
Table of Contents
Q.1. What is financial management? Explain the objectives of financial management.
Financial management is the process of managing an organization’s financial resources to achieve its goals and objectives effectively. It involves planning, organizing, directing, and controlling the financial activities of a business organization to ensure efficient use of financial resources.
The main objectives of financial management are as follows:
- Profit Maximization: Financial management aims to maximize the profits of the business by ensuring that it generates maximum returns from its investments and reduces costs wherever possible.
- Wealth Maximization: The ultimate goal of financial management is to maximize the wealth of the shareholders. This is achieved by increasing the value of the company’s shares through efficient management of financial resources.
- Proper Utilization of Funds: Financial management aims to ensure that the funds of the organization are utilized properly and efficiently to maximize returns and minimize risk.
- Liquidity Management: Financial management ensures that the organization has sufficient funds to meet its short-term obligations as and when they arise.
- Risk Management: Financial management aims to minimize financial risks by assessing and managing various financial risks such as market risks, credit risks, and operational risks.
- Cost Control: Financial management aims to control costs by ensuring that the organization spends its financial resources judiciously and avoids unnecessary expenses.
- Maximizing Shareholder Value: Financial management aims to maximize shareholder value by ensuring that the organization generates adequate profits and distributes a portion of the profits to the shareholders in the form of dividends.
In summary, the main objective of financial management is to ensure the effective management of financial resources of an organization to achieve its goals and objectives. It aims to balance the conflicting goals of maximizing profits and minimizing risks while ensuring the proper utilization of funds and maximizing shareholder value.
OR
Explain financial statement and its types.
Financial Statements represent a formal record of the financial activities of an entity. These are written reports that quantify the financial strength, performance and liquidity of a company. Financial Statements reflect the financial effects of business transactions and events on the entity.
Five Types of Financial Statements
The five main types of financial statements are:
Statement of Financial Position
Statement of Financial Position, also known as the Balance Sheet, presents the financial position of an entity at a given date. It is comprised of the following three elements:
- Assets:Something a business owns or controls (e.g. cash, inventory, plant and machinery, etc)
- Liabilities:Something a business owes to someone (e.g. creditors, bank loans, etc)
- Equity:What the business owes to its owners. This represents the amount of capital that remains in the business after its assets are used to pay off its outstanding liabilities. Equity therefore represents the difference between the assets and liabilities.
Income Statement
Income Statement, also known as the Profit and Loss Statement, reports the company’s financial performance in terms of net profit or loss over a specified period. Income Statement is composed of the following two elements:
- Income:What the business has earned over a period (e.g. sales revenue, dividend income, etc)
- Expense:The cost incurred by the business over a period (e.g. salaries and wages, depreciation, rental charges, etc)
Cash Flow Statement
Cash Flow Statement, presents the movement in cash and bank balances over a period. The movement in cash flows is classified into the following segments:
- Operating Activities: Represents the cash flow from primary activities of a business.
- Investing Activities: Represents cash flow from the purchase and sale of assets other than inventories (e.g. purchase of a factory plant)
- Financing Activities: Represents cash flow generated or spent on raising and repaying share capital and debt together with the payments of interest and dividends.
Statement of Changes in Equity
Statement of Changes in Equity, also known as the Statement of Retained Earnings, details the movement in owners’ equity over a period. The movement in owners’ equity is derived from the following components:
- Net Profit or loss during the period as reported in theincome statement
- Share capital issued or repaid during the period
- Dividend payments
- Gains or losses recognized directly in equity (e.g. revaluation surpluses)
- Effects of achange in accounting policy or correction of accounting error.
Fund Flow Statement
The fund flow statement, also known as the Application of Funds and Statement of Sources, is a statement designed to analyse changes in the financial position of enterprises. This statement will include the following components to show the sources of funds received and their expenditures:
- Application of funds: how the funds have been utilised by the organisation
- Sources of funds: how the funds have been incurred by the organisation.
Q.2. What is financial planning? Explain the importance of financial planning.
Financial planning refers to the process of assessing an individual’s or a company’s financial goals and creating a roadmap to achieve them. It involves analyzing current financial status, identifying future goals, developing strategies to achieve those goals, and monitoring progress towards them. The main objective of financial planning is to ensure that resources are used efficiently and effectively to meet the desired financial goals, some followed importance of Financial Planning are:-
- Helps Achieve Financial Goals: Financial planning is essential for setting and achieving financial goals. Whether it is saving for a down payment on a home, planning for retirement, or investing for the future, a financial plan helps individuals prioritize their goals and allocate resources accordingly. By setting specific goals and creating a plan to achieve them, individuals can take control of their finances and make progress towards their objectives.
- Promotes Financial Stability: Financial planning is critical for achieving financial stability. A solid financial plan ensures that individuals have enough money to cover their living expenses, manage debt, and save for emergencies. It also helps individuals avoid financial pitfalls such as overspending, high-interest debt, and poor investment decisions. A sound financial plan promotes financial security and minimizes financial stress.
- Provides a Roadmap for the Future: A financial plan provides a roadmap for the future, outlining how individuals can achieve their financial goals and what steps they need to take to get there. A good financial plan includes a budget, savings goals, investment strategy, and retirement plan, among other things. By having a clear roadmap for the future, individuals can make informed financial decisions and stay on track towards their goals.
- Minimizes Financial Risks: Financial planning helps individuals minimize financial risks by identifying potential threats and creating strategies to mitigate them. For example, a financial plan may include insurance policies to protect against unexpected events such as illness or disability. It may also include diversifying investments to minimize the impact of market fluctuations.
- Improves Decision Making: A financial plan helps individuals make informed financial decisions by providing a clear understanding of their financial situation and goals. It provides a framework for evaluating financial options and choosing the best course of action. By making informed decisions, individuals can maximize their financial resources and achieve their goals more quickly.
OR
Distinguish between fund flow statement and cash flow statement.
|
Funds Flow Statement |
Cash Flow Statement |
|
1. Funds flow statement is the report on the movement of funds or working capital |
1. Cash flow statement is the report showing sources and uses of cash. |
|
2. Funds flow statement explains how working capital is raised and used during the particular |
2. Cash flow statement explains the inflow and out flow of cash during the particular period. |
|
3. The main objective of fund flow statement is to show the how the resources have been balanced mobilised and used. |
3. The main objective of the cash flow statement is to show the causes of changes in cash between two balance sheet dates. |
|
4. Funds flow statement indicates the results of current financial management. |
4. Cash flow statement indicates the factors contributing to the reduction of the cash balance in spite of the increase in profit and vice-versa. |
|
5. In a funds flow statement increase or decrease in working capital is recorded. |
5. In a cash flow statement, only cash receipt and payments are recorded. |
|
6. In funds flow statement there is no opening and closing balances. |
6. Cash flow statement starts with opening cash balance and ends with closing cash balance. |
Q.3. What do you understand by Financial Analysis and what are its objectives?
Financial analysis is the process of examining an organization’s financial statements and data to assess its financial health and performance. Financial analysis involves the use of various financial tools and techniques to analyze the financial data of the organization.
Objectives of financial analysis:
- Assessing financial performance: One of the primary objectives of financial analysis is to assess the financial performance of an organization. It helps in analyzing the company’s profitability, liquidity, solvency, and stability over a period.
- Identifying trends and patterns: Financial analysis helps in identifying the trends and patterns in the company’s financial statements over a period. This can help the company to identify areas of strength and weakness in its operations.
- Evaluating investment opportunities: Financial analysis helps investors to evaluate the potential of investing in the company. It helps in assessing the company’s financial health and performance, which can help investors to make informed investment decisions.
- Assessing the creditworthiness of the organization: Financial analysis helps in assessing the creditworthiness of the organization. It helps creditors to assess the ability of the company to repay the loans and interest on time.
- Making strategic decisions: Financial analysis helps in making strategic decisions such as mergers and acquisitions, expansion plans, and divestitures. It provides insights into the company’s financial health, which can help in making informed decisions.
Features of Financial Analysis:
- Quantitative analysis: Financial analysis involves the use of quantitative techniques to analyze financial data. This helps in assessing the financial performance of the organization.
- Comparability: Financial analysis involves comparing the company’s financial statements over a period or with other companies. This helps in assessing the company’s financial performance and identifying areas of improvement.
- Timeframe: Financial analysis involves analyzing financial data over a period. This helps in identifying trends and patterns in the company’s financial performance.
- Historical perspective: Financial analysis involves analyzing historical financial data. This helps in assessing the company’s financial health and performance over a period.
- Industry-specific: Financial analysis is specific to the industry in which the organization operates. This helps in identifying industry-specific factors that can impact the company’s financial health and performance.
- Use of ratios: Financial analysis involves the use of financial ratios to assess the company’s financial performance. This helps in comparing the company’s financial performance with industry benchmarks and identifying areas of improvement.
OR
Write short notes on any two:
(a) Debt-equity Ratio
(b) Du Pont Control Chart
(c) Deferred Revenue Expenditure
(a) Debt-Equity Ratio: Debt-equity ratio is a financial ratio that compares the amount of debt a company has to the amount of equity. It is calculated by dividing total debt by total equity. The debt-equity ratio provides an indication of the degree of leverage or financial risk a company has taken on. A high debt-equity ratio indicates that a company has a significant amount of debt relative to equity and may be at a higher risk of default or bankruptcy. On the other hand, a low debt-equity ratio indicates that a company has a higher proportion of equity relative to debt, which may provide more financial stability and flexibility. Debt-equity ratios are commonly used by investors and analysts to evaluate a company’s financial health and risk profile.
(b) Du Pont Control Chart: Du Pont control chart is a statistical tool used to monitor the performance of a process over time. It is named after the Du Pont Corporation, which first used the chart to monitor the quality of its products. The Du Pont control chart is based on the concept of process capability, which refers to the ability of a process to produce products or services that meet customer requirements. The chart is used to identify changes in the process that may affect its capability and to take corrective action if necessary. The Du Pont control chart plots the average of a process over time, along with its upper and lower control limits. The chart helps to identify any changes in the process that may be due to special causes, such as machine breakdowns or operator errors, and to distinguish them from common causes, which are inherent in the process. The Du Pont control chart is a valuable tool for quality control and process improvement.
(c) Deferred Revenue Expenditure: Deferred revenue expenditure refers to expenses that are incurred during a particular accounting period but are not charged to the income statement in that period. Instead, they are treated as assets and are amortized over a period of time. Deferred revenue expenditures are usually incurred to obtain future benefits, such as research and development costs, advertising expenses, and start-up costs. These expenditures are not immediately recognized as expenses because they do not provide immediate benefits to the company. Instead, they are capitalized as assets and are amortized over the useful life of the asset. This allows the company to spread the cost of the expenditure over several accounting periods and to match the cost with the revenue generated by the asset. Deferred revenue expenditure is an important concept in accounting, as it helps to ensure that expenses are recognized in the correct period and that the financial statements accurately reflect the financial position of the company.
Q.4. Define working capital. What factors would you take into consideration in
estimating the working capital?
Working capital is the amount of money that a company has available to finance its day-to-day operations. It represents the difference between a company’s current assets and current liabilities. Working capital is a measure of a company’s liquidity and ability to meet its short-term financial obligations.
Factors to Consider in Estimating Working Capital:
- Nature of the Business: The type of business a company is engaged in can impact the amount of working capital needed. For example, a manufacturing company may require a larger amount of working capital to purchase raw materials and pay for production costs than a service-based business.
- Seasonality: If a company experiences seasonal fluctuations in its sales and cash flow, it may require more working capital during peak periods to finance its operations and maintain sufficient inventory levels.
- Sales Forecast: The level of sales a company expects to generate can impact its working capital needs. If a company anticipates increased sales, it may need to invest in additional inventory or hire more staff, which can require more working capital.
- Credit Policy: If a company offers credit terms to its customers, it may need more working capital to finance its accounts receivable and maintain sufficient cash flow.
- Supplier Payment Terms: The payment terms offered by a company’s suppliers can impact its working capital needs. If a company is required to make payments to suppliers quickly, it may require more working capital to finance these payments.
- Operating Efficiency: A company’s operating efficiency can impact its working capital needs. For example, if a company can manage its inventory levels and accounts receivable effectively, it may require less working capital than a company that is less efficient.
- Debt Obligations: A company’s debt obligations, such as loans and interest payments, can impact its working capital needs. If a company has a high level of debt, it may require more working capital to service its debt and maintain sufficient cash flow.
- Economic Environment: The overall economic environment, including interest rates, inflation, and consumer spending, can impact a company’s working capital needs. For example, in a high inflation environment, a company may require more working capital to maintain sufficient inventory levels and manage its cash flow.
In conclusion, working capital is a critical component of a company’s financial health, as it represents the amount of money available to finance its day-to-day operations. When estimating working capital, it is important to consider factors such as the nature of the business, seasonality, sales forecast, credit policy, supplier payment terms, operating efficiency, debt obligations, and the economic environment. By carefully managing its working capital needs, a company can ensure that it has sufficient liquidity to meet its short-term financial obligations and operate effectively over the long term.
OR
What do you understand by the term “Capital Structure”? State the factors
responsible for such a state of affairs.
Capital structure refers to the mix of different types of capital, such as debt and equity, that a company uses to finance its operations and growth. The capital structure of a company plays a critical role in determining its financial health, as well as its ability to meet its obligations and invest in new projects.
Several factors can influence a company’s capital structure, including:
- Business Risk: The nature of a company’s business and its level of risk can influence its capital structure. Companies with higher levels of risk may choose to use more debt financing to take advantage of the tax benefits of debt while companies with lower levels of risk may use more equity financing to avoid the risks associated with debt.
- Financial Flexibility: A company’s capital structure is also influenced by its financial flexibility, which refers to its ability to obtain financing when needed. Companies with a strong financial position and good credit ratings may have more flexibility in choosing their capital structure.
- Cost of Capital: The cost of capital refers to the cost of financing a company’s operations and investments. The cost of debt is usually lower than the cost of equity due to the tax advantages of debt, but companies must also consider the risk of default when using debt financing.
- Market Conditions: The prevailing market conditions can also influence a company’s capital structure. For example, during a period of low interest rates, companies may choose to use more debt financing as it is cheaper to obtain, while during a period of high interest rates, companies may choose to use more equity financing.
- Growth Opportunities: A company’s growth opportunities and investment plans can also influence its capital structure. Companies that have significant growth opportunities may choose to use more equity financing to fund their expansion, while companies that have limited growth opportunities may use more debt financing to optimize their capital structure.
Overall, a company’s capital structure should be designed to strike a balance between risk and return while ensuring that it has sufficient financial flexibility to meet its obligations and invest in growth opportunities.
Q.5. Distinguish between (any two):
(a) Gross Profit and Net Profit
(a) Gross Profit and Net Profit: Gross profit is the difference between the revenue earned from sales and the cost of goods sold. It represents the amount of money a company has made from its operations before deducting any other expenses such as administrative costs, taxes, and interest payments. Net profit, on the other hand, is the profit a company makes after deducting all of its expenses, including the cost of goods sold, operating expenses, taxes, interest, and any other charges. In simple terms, gross profit is the profit earned before deducting expenses, while net profit is the profit earned after deducting all expenses.
(b) Over Trading and Under Trading
(b) Over Trading and Under Trading: Overtrading occurs when a company expands its operations beyond its current financial capacity, leading to cash flow problems, and a situation where the company is unable to meet its obligations. This can happen when a company takes on more orders than it can handle or expands too quickly without having the necessary resources to support the growth. Undertrading, on the other hand, is when a company operates below its optimal level, resulting in lower profits and returns. This can happen when a company is too conservative in its operations, fails to take advantage of opportunities, or operates inefficiently.
(c) Equity Shares and Preference Shares
(c) Equity Shares and Preference Shares: Equity shares, also known as common shares, represent ownership in a company and give shareholders a right to vote on company decisions and receive dividends based on the company’s profitability. Equity shareholders have a residual claim on a company’s assets and earnings after all other claims have been paid. Preference shares, on the other hand, represent a hybrid form of ownership between equity and debt. Preference shareholders receive a fixed dividend before any dividends are paid to equity shareholders and have a higher priority in the event of a company’s liquidation. However, they do not have voting rights and have limited participation in the company’s decision-making process.
Q.6. Prepare a Statement of Changes in Working Capital from the following balance sheet as on 31st December:
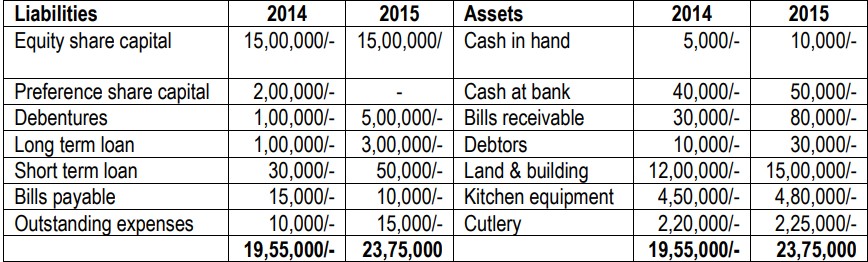
Statement of Changes in Working Capital as on 31st December:
Particulars |
2014 |
2015 |
Increase/Decrease |
|---|---|---|---|
Current Assets |
|||
Cash in hand |
5,000 |
10,000 |
+5,000 |
Cash at bank |
40,000 |
50,000 |
+10,000 |
Bills receivable |
30,000 |
80,000 |
+50,000 |
Debtors |
10,000 |
30,000 |
+20,000 |
Total Current Assets |
85,000 |
170,000 |
+85,000 |
Current Liabilities |
|||
Short term loan |
30,000 |
50,000 |
+20,000 |
Bills payable |
15,000 |
10,000 |
-5,000 |
Outstanding expenses |
10,000 |
15,000 |
+5,000 |
Total Current Liabilities |
55,000 |
75,000 |
+20,000 |
Working Capital |
30,000 |
95,000 |
+65,000 |
Note: The working capital for 2014 is (85,000 – 55,000) = 30,000 and for 2015 is (170,000 – 75,000) = 95,000. The increase in working capital is calculated by subtracting the working capital of 2014 from the working capital of 2015, which is 95,000 – 30,000 = 65,000.
Q.7. The Balance Sheet of Maruti Suzuki Ltd. as on 31.12.2016 was as follows:
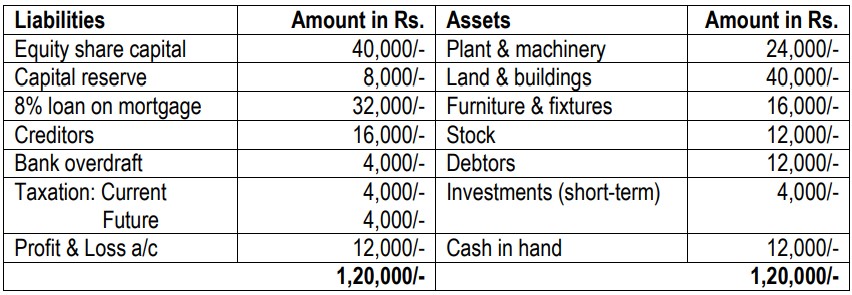
From the above, compute:
(a) Current ratio
(b) Quick ratio
(c) Debt equity ratio
(d) Proprietary ratio
(a) Current Ratio = Current Assets / Current Liabilities
Current Assets = Stock + Debtors + Cash in hand + Investments (short-term) = 12,000 + 12,000 + 12,000 + 4,000 = 40,000
Current Liabilities = Creditors + Bank overdraft + Taxation (Current) = 16,000 + 4,000 + 4,000 = 24,000
Current Ratio = 40,000 / 24,000 = 1.67
(b) Quick Ratio = (Current Assets – Stock) / Current Liabilities
Quick Assets = Debtors + Cash in hand + Investments (short-term) = 12,000 + 12,000 + 4,000 = 28,000
Quick Ratio = (28,000) / (24,000) = 1.17
(c) Debt Equity Ratio = Total Debt / Total Equity
Total Debt = 8% loan on mortgage + Creditors + Bank overdraft + Taxation (Current) + Taxation (Future) = 32,000 + 16,000 + 4,000 + 4,000 + 4,000 = 60,000
Total Equity = Equity share capital + Capital reserve + Profit & Loss a/c = 40,000 + 8,000 + 12,000 = 60,000
Debt Equity Ratio = 60,000 / 60,000 = 1
(d) Proprietary Ratio = Shareholders’ Funds / Total Assets
Shareholders’ Funds = Equity share capital + Capital reserve + Profit & Loss a/c = 40,000 + 8,000 + 12,000 = 60,000
Total Assets = Plant & machinery + Land & buildings + Furniture & fixtures + Stock + Debtors + Cash in hand + Investments (short-term) = 24,000 + 40,000 + 16,000 + 12,000 + 12,000 + 12,000 + 4,000 = 1,20,000
Proprietary Ratio = 60,000 / 1,20,000 = 0.50
Q.8. Mr. Agarwal has received two project proposals: Project ‘X’ and ‘Y’. Comment which project is better, using (i) Net present value method (ii) Internal rate of return method assuming 10% as the rate of discount.

Assume following data:
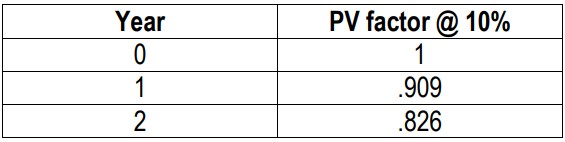
To determine which project is better, we need to calculate the net present value (NPV) and internal rate of return (IRR) for each project using the given data.
(i) Net Present Value Method:
For Project X:
NPV = (PV of cash inflows) – (Initial investment) NPV = [3,00,000 x 0.909] + [3,00,000 x 0.826] – 5,00,000 NPV = 2,72,970 – 5,00,000 NPV = -2,27,030
For Project Y:
NPV = (PV of cash inflows) – (Initial investment) NPV = [2,50,000 x 0.909] + [2,50,000 x 0.826] – 4,00,000 NPV = 2,27,025 – 4,00,000 NPV = -1,72,975
Therefore, based on the net present value method, Project Y is better than Project X.
(ii) Internal Rate of Return Method:
For Project X:
IRR = r + [(NPV at r) / (PV of cash inflows at r)] We need to find the rate of discount (r) at which NPV is equal to zero. At r = 10%, NPV is negative (-2,27,030). At r = 11%, NPV becomes positive. IRR for Project X is approximately 11%.
For Project Y:
IRR = r + [(NPV at r) / (PV of cash inflows at r)] We need to find the rate of discount (r) at which NPV is equal to zero. At r = 10%, NPV is negative (-1,72,975). At r = 13%, NPV becomes positive. IRR for Project Y is approximately 13%.
Therefore, based on the internal rate of return method, Project Y is better than Project X.
Q.9. Following are the balance sheet of M/s. Kashyap Ltd., for the years 2014 and 2015. Prepare a comparative balance sheet of the firm:
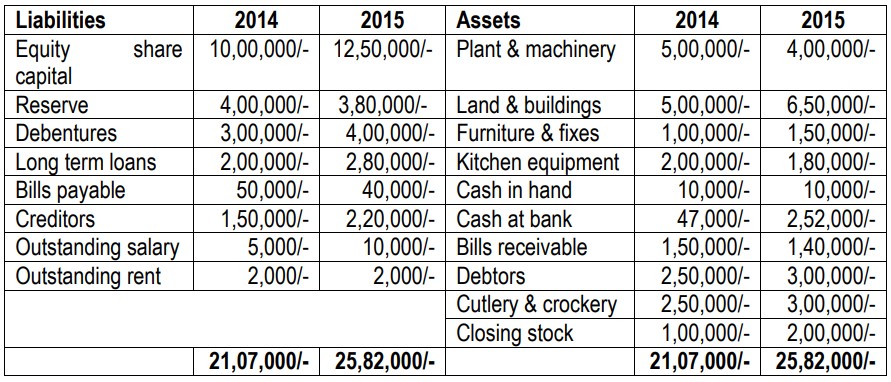
Comparative balance sheet of M/s. Kashyap Ltd. for the years 2014 and 2015:
Particulars |
2014 (Amount in Rs.) |
2015 (Amount in Rs.) |
Increase (+) or Decrease (-) |
|---|---|---|---|
Assets |
|||
Plant & machinery |
5,00,000/- |
4,00,000/- |
-1,00,000/- |
Land & buildings |
5,00,000/- |
6,50,000/- |
+1,50,000/- |
Furniture & fixtures |
1,00,000/- |
1,50,000/- |
+50,000/- |
Kitchen equipment |
2,00,000/- |
1,80,000/- |
-20,000/- |
Cash in hand |
10,000/- |
10,000/- |
0 |
Cash at bank |
47,000/- |
2,52,000/- |
+2,05,000/- |
Bills receivable |
1,50,000/- |
1,40,000/- |
-10,000/- |
Debtors |
2,50,000/- |
3,00,000/- |
+50,000/- |
Cutlery & crockery |
2,50,000/- |
3,00,000/- |
+50,000/- |
Closing stock |
1,00,000/- |
2,00,000/- |
+1,00,000/- |
Total Assets |
21,07,000/- |
25,82,000/- |
+4,75,000/- |
Liabilities |
|||
Equity share capital |
10,00,000/- |
12,50,000/- |
+2,50,000/- |
Reserves |
4,00,000/- |
3,80,000/- |
-20,000/- |
Debentures |
3,00,000/- |
4,00,000/- |
+1,00,000/- |
Long term loans |
2,00,000/- |
2,80,000/- |
+80,000/- |
Bills payable |
50,000/- |
40,000/- |
-10,000/- |
Creditors |
1,50,000/- |
2,20,000/- |
+70,000/- |
Outstanding salary |
5,000/- |
10,000/- |
+5,000/- |
Outstanding rent |
2,000/- |
2,000/- |
0 |
Total Liabilities |
21,07,000/- |
25,82,000/- |
+4,75,000/- |
Working Capital |
|||
Current assets |
15,57,000/- |
19,82,000/- |
+4,25,000/- |
Current liabilities |
2,57,000/- |
3,90,000/- |
+1,33,000/- |
Working Capital |
13,00,000/- |
15,92,000/- |
+2,92,000/- |
Q.10. From the following balance sheet of M/s. Mukesh & Co for the year ending 31st December 2014 and 2015, prepare Schedule of Changes in Working Capital and Fund Flow Statement:

Schedule of Changes in Working Capital:
Particulars |
2014 |
2015 |
Increase/Decrease |
|---|---|---|---|
Current Assets |
|||
Cash |
47,000/- |
70,000/- |
+23,000/- |
Debtors |
1,00,000/- |
90,000/- |
-10,000/- |
Closing Stock |
1,53,000/- |
2,05,000/- |
+52,000/- |
Total Current Assets |
3,00,000/- |
3,65,000/- |
+65,000/- |
Current Liabilities |
|||
Creditors |
90,000/- |
60,000/- |
-30,000/- |
Bills Payable |
60,000/- |
50,000/- |
-10,000/- |
Total Current Liabilities |
1,50,000/- |
1,10,000/- |
-40,000/- |
Working Capital (CA-CL) |
1,50,000/- |
2,55,000/- |
+1,05,000/- |
Fund Flow Statement:
Particulars |
2014 |
2015 |
Increase/Decrease |
|---|---|---|---|
Sources of Funds |
|||
Increase in Equity Share Capital |
1,00,000/- |
+1,00,000/- |
|
Increase in Reserves |
25,000/- |
25,000/- |
– |
Total Sources of Funds |
25,000/- |
1,25,000/- |
+1,00,000/- |
Application of Funds |
|||
Purchase of Land and Buildings |
10,000/- |
– |
|
Purchase of Kitchen Equipment |
10,000/- |
– |
|
Purchase of Cutlery & Crockery |
5,000/- |
– |
|
Purchase of Furniture & Fixtures |
5,000/- |
– |
|
Increase in Debtors |
10,000/- |
– |
-10,000/- |
Increase in Closing Stock |
52,000/- |
– |
-52,000/- |
Payment of Creditors |
-50,000/- |
30,000/- |
+80,000/- |
Payment of Bills Payable |
-20,000/- |
10,000/- |
+30,000/- |
Increase in Profit & Loss A/c |
10,000/- |
10,000/- |
– |
Total Application of Funds |
2,02,000/- |
70,000/- |
-1,32,000/- |
Net Increase in Funds |
-1,77,000/- |
55,000/- |
+2,32,000/- |