
Table of Contents
Q.1. What is the role of managerial economise in preparing managers ? Give suitable examples. (20)
Role of managerial economics in preparing managers to work effectively
Successful mangers make good decisions, and one of their most useful tools is the methodology of managerial economics. Warren E Buffett, the renowned chairman and CEO of Berkshire Hathaway Inc., invested $100 and went on to accumulate a personal net worth of $30 billion. Buffett credits his success to a basic understanding of managerial economics. Buffett’s success is a powerful testimony to the practical usefulness of managerial economics.
Managerial economics has a very important role to play by helping managements in successful decision making and forward planning. To discharge his role successfully, a manager must recognize his responsibilities and obligations. There is a growing realization that the managers contribute significantly to the profitable growth of the firms.
A successful managerial economist must be a mathematician, a statistician and an economist. He must be also able to combine philosophic methods with historical methods to get the right perspective only then; he will be good at predictions. In short managerial practices with the help of other allied sciences.
A managerial economist helps the management by using his analytical skills and highly developed techniques in solving complex issues of successful decision-making and future advanced planning.
Managerial economics, or business economics, is a division of microeconomics that focuses on applying economic theory directly to businesses. The application of economic theory through statistical methods helps businesses make decisions and determine strategy on pricing, operations, risk, investments and production. The overall role of managerial economics is to increase the efficiency of decision making in businesses to increase profit.
The role of economics in management can be summarized as follows:
• Study of economic pattern at macro-level and analysis its significance to the organization and its functioning
• Examine how the changing environment is profitable to ones organization in the best possible way
• Helps is making sound decision by choosing the best available alternative in case of choices.
• Many managerial economic tools and analysis models are used to help make investing decisions both for corporations and savvy individual investors. These tools are used to make stock market investing decisions and decisions on capital investments for a business.
• Assists businesses in determining pricing strategies and appropriate pricing levels for their products and services. Some common analysis methods are price discrimination, value-based pricing and cost-plus pricing
• Assists the management in the decisions pertaining to internal functioning of a firm such as changes in price, investment plans, type of goods /services to be produced, inputs to be used, etc…
• Analyse changes in macroeconomic indicators such as national income, population, business cycles, and their possible effect on the firm’s functioning.
• The most significant function of a managerial economist is to conduct a detailed research on industrial market.
• He also provides management with economic information such as tax rates, competitor’s price and product, etc. They give their valuable advice to government authorities as well.
• Uncertainty exits in every business and managerial economics can help reduce risk through uncertainty model analysis and decision-theory analysis. Heavy use of statistical probability theory helps provide potential scenarios for businesses to use when making decisions.
We can conclude that managerial economics consists of applying economic principles and concepts towards adjusting with various uncertainties faced by a business firm.
Q.2. Discuss with examples, how managerial economics is an integral part of business activity. (20)
For most purposes economics can be divided into two broad categories, microeconomics and macroeconomics. Macroeconomics as the name suggests is the study of the overall economy and its aggregates such as Gross National Product, Inflation, Unemployment, Exports, Imports, Taxation Policy etc.
Macroeconomics addresses questions about changes in investment, government spending, employment, prices, exchange rate of the rupee and so on. Importantly, only aggregate levels of these variables are considered in the study of macroeconomics. But hidden in the aggregate data are changes in output of a number of individual firms, the consumption decision of consumers like you, and the changes in the prices of particular goods and services.
Although macroeconomic issues are important and occupy the time of media and command the attention of the newspapers, micro aspects of the economy are also important and often are of more direct application to the day to day problems facing a manager. Microeconomics deals with individual actors in the economy such as firms and individuals. Managerial economics can be thought of as applied microeconomics and its focus is on the interaction of firms and individuals in markets.
The economy is the institutional structure through which individuals and firms in a society coordinate their desires. Economics is the study of how human beings in a society go about achieving their wants and desires. It is also defined as the study of allocation of scarce resources to satisfy individual wants or desires. The latter is perhaps the best way to broadly define the study of economics in general. The emphasis is on allocation of scarce resources across competing ends. You should recognize that human wants are unlimited and therefore choice is necessary.
Choices necessarily involve trade-offs. For example, if you wish to acquire an MBA degree, you must take time off to devote to study. Your time has many uses and when you devote more time to study you are allocating it to a particular use in order to achieve your goal. Economics would be a most uninteresting subject if resources were unlimited and no trade offs were involved in decision making.
There are many general insights economists have gained into how the economy functions. Economic theory ties together economists’ terminology and knowledge about economic institutions. An economic institution is a physical or mental structure that significantly influences economic decisions. Corporations, governments, markets are all economic institutions. Similarly cultural norms are the standards people use when they determine whether a particular activity or behaviour is acceptable. For example, Hindus avoid meat and fish on Tuesdays.
This has an economic dimension as it has a direct impact on the sale of these items on Tuesdays. Further, economic policy is the action usually taken by the government, to influence economic events. And finally, economic reasoning helps in thinking like an economist. Economists analyse questions and issues on the basis of trade-offs i.e. they compare the cost and the benefits of every issue and make decisions based on those costs and benefits.
The market is perhaps the single most important and complex institution in our economy. A market is not necessarily a physical location, but a description of any state that involves exchange. The exchange could be instantaneous or it could be over time i.e. exchange which is agreed today but where the transaction takes place, say after 3 months. Markets could be competitive or monopolistic, with a large number of firms or a small number of firms, with free entry and exit or government licensing restricting entry of firms and so on. The major point is that firms operate in different types of markets and use the well-established principles of managerial economics to improve profitability. Managerial economics draws on economic analysis for such concepts as cost, demand, profit and competition. It attempts to bridge the gap between the purely analytical problems that intrigue many economic theorists and the day-to-day decisions that managers must face. It offers powerful tools and approaches for managerial policy-making. It will be relevant to present here several examples illustrating the problems that managerial economics can help to address.
These also explain how managerial economics is an integral part of business. Demand, supply, cost, production, market, competition, price etc. are important concepts in real business decisions.
Q.3. Critically analyse the effect of advertising on demand. Give suitable examples from hospitality industry. (20)
Advertising influences our attitudes towards the product or service being promoted. In most cases, the intent of a firm’s advertising is to stimulate sales of a particular product or product line. When Pepsi Cola Corporation decides to sponsor a television show or cricket match it hopes that doing so will increase the sales of its products. Such product promotions have their impact on consumers through tastes and preferences.
In addition to shifting the demand function to the right, advertising may have the effect of making it somewhat more steep. The reason for this is that advertisements can create stronger consumer brand preferences, thus making consumers less sensitive to price changes for that product. This means that one effect of advertising can be to make the demand for a firm’s product more price- inelastic. To the extent that this is true, management has an increased ability to raise price without losing as many sales as would have been lost otherwise. We have seen that raising the product’s price will increase total revenue for the firm if demand is inelastic.
For example, a commercial for a fairly inexpensive good, such as a hamburger, may result in a quick bump in sales. On the other hand, advertising for a luxury item—such as an expensive car or piece of jewelry—may not see a payback for some time because the good is costly and is less likely to be purchased on a whim.
Q.4. When can we say that a firm is
a. technically efficient
b. economically efficient?
Is it necessary that technically efficient firm is also economically efficient? Give suitable examples from hospitality industry. (20)
Firm is technically efficient
We can say that a firm is technically efficient when it obtains maximum level of output from any given combination of inputs. The production function incorporates the technically efficient method of production. A producer cannot decrease one input and at the same time maintain the output at the same level without increasing one or more inputs. When economists use production functions, they assume that the maximum output is obtained from any given combination of inputs. That is, they assume that production is technically efficient.
Firm is economically efficient
On the other hand, we can say a firm is economically efficient, when it produces a given amount of output at the lowest possible cost for a combination of inputs provided that the prices of inputs are given. Therefore, when only input combinations are given, we deal with the problem of technical efficiency; that is, how to produce maximum output. On the other hand, when input prices are also given in addition to the combination of inputs, we deal with the problem of economic efficiency; that is, how to produce a given amount of output at the lowest possible cost.
Relation between Technically efficient and economically efficient
• Technical efficiency happens when there is no possibility to increase the output without increasing the input.
• Economic efficiency happens when the production cost of an output is as low as possible.
• Technical efficiency is really a prerequisite for economic efficiency. In order to achieve economic efficiency, one should have achieved technical efficiency.
• An economic efficiency is a state in which every resource is made use of to serve each person in the very best way while minimizing inefficiency and waste.
• Once there is economic efficiency, any change that is made to assist any person is likely to harm others.
• Economic efficiency mainly depends on the prices related to the factors of production. Technical efficiency is considered an engineering matter.
Q.5. Write short note on the following : (10 x 2 =20)
a. Oligopolistic Competition
Oligopoly is the form of market organization in which there are few sellers of a homogeneous or differentiated product. If there are only two sellers, we have a duopoly. If the product is homogeneous, we have a pure oligopoly. If the product is differentiated, we have a differentiated oligopoly. While entry into an oligopolistic industry is possible, it is not easy (as evidenced by the fact that there are only a few firms in the industry).
Oligopoly is the most prevalent form of market organization in the manufacturing sector of most nations, including India. Some oligopolistic industries in India are automobiles, primary aluminum, steel, electrical equipment, glass, breakfast cereals, cigarettes, and many others. Some of these products (such as steel and aluminum) are homogeneous, while others (such as automobiles, cigarettes, breakfast cereals, and soaps and detergents) are differentiated. Oligopoly exists also when transportation costs limit the market area. For example, even though there are many cement producers in India, competition is limited to the few local producers in a particular area.
Since there are only a few firms selling a homogeneous or differentiated product in oligopolistic markets, the action of each firm affects the other firms in the industry and vice versa.
For example, when General Motors introduced price rebates in the sale of its automobiles, Ford and Maruti immediately followed with price rebates of their own. Furthermore, since price competition can lead to ruinous price wars, oligopolists usually prefer to compete on the basis of product differentiation, advertising, and service. These are referred to as nonprice competition. Yet, even here, if GM mounts a major advertising campaign, Ford and Maruti are likely to soon respond in kind. When Pepsi mounted a major advertising campaign in the early 1980s Coca-Cola responded with a large advertising campaign of its own in the United States.
b. Stages of Production
Based on the behaviour of Marginal Product (MP) and Average Product (AP), economists have classified production into three stages:
Stage 1: MP > 0, AP rising. Thus, MP > AP.
Stage 2: MP > 0, but AP is falling. MP < AP but TP is increasing (because MP > 0).
Stage 3: MP < 0. In this case Total Product (TP) is falling.
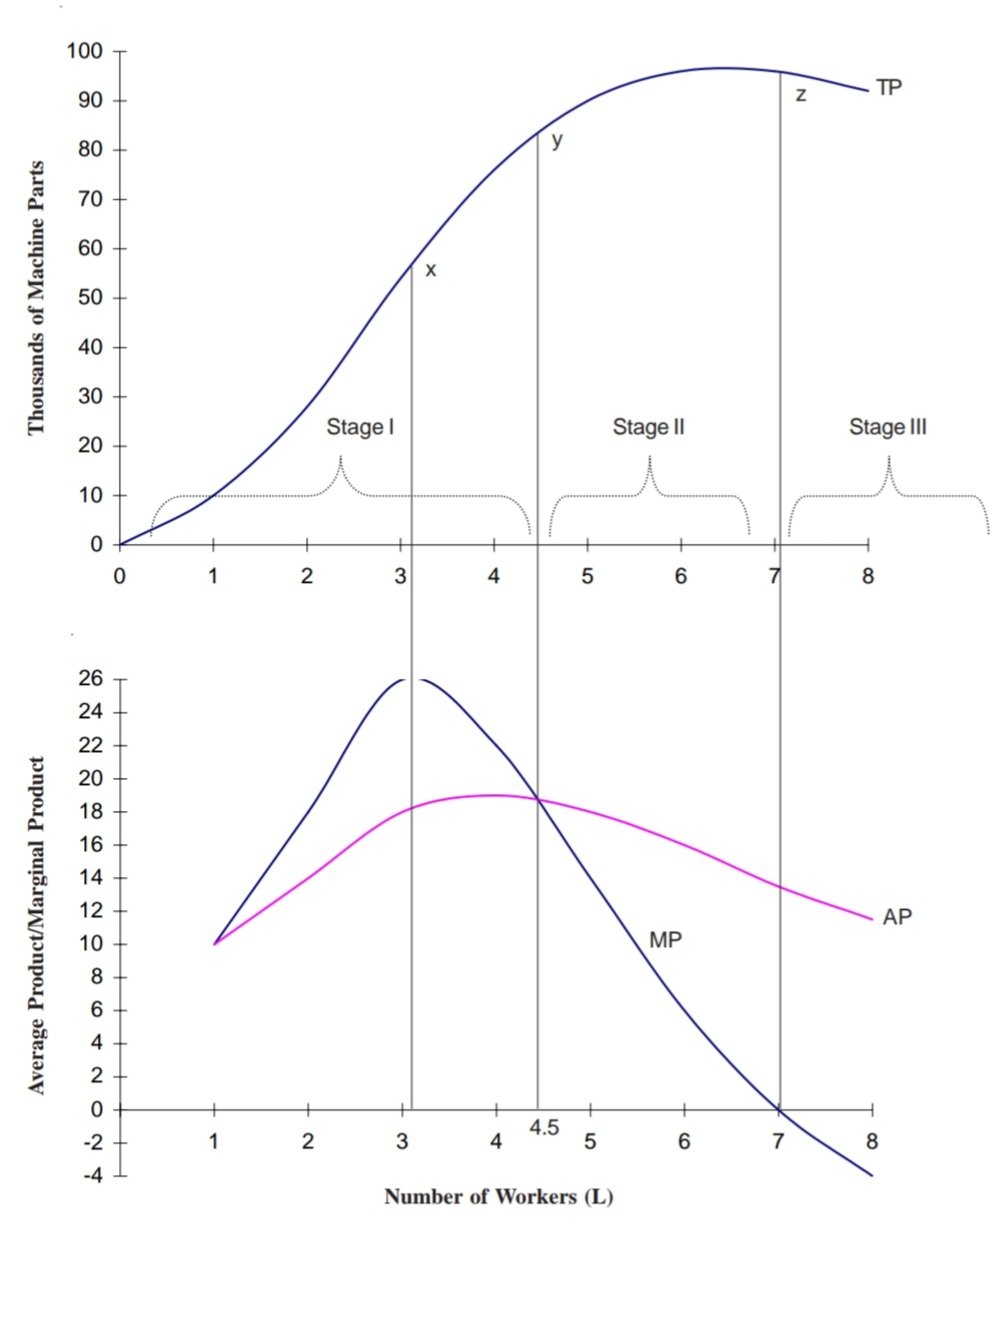
Relationship between TP, MP, and AP curves and the three stages of production
No profit-maximising producer would produce in stages I or III. In stage I, by adding one more unit of labour, the producer can increase the AP of all units. Thus, it would be unwise on the part of the producer to stop the production in this stage. As for stage III, it does not pay the producer to be in this region because by reducing the labour input the total output can be increased and the cost of a unit of labour can be saved.
Thus, the economically meaningful range is given by stage II. In Figure at the point of inflection (x), we saw earlier that MP is maximised. At point y, since AP is maximized, we have AP = MP. At point z, TP reaches a maximum. Thus, MP = 0 at this point. If the variable input is free then the optimum level of output is at point z where TP is maximized. However, in practice no input will be freely available. The producer has to pay a price for it. Suppose the producer pays Rs. 200 per worker per day and the price of a unit of output (say one apple) is Rs. 10. In this case the producer will keep on hiring additional workers as long as
(price of a unit of output) * (marginal product of labour) > (price of a unit of labour)
That is, marginal revenue of product (MRP) of labour > PL
On a similar analogy,
(price of a unit of output) * (marginal product of capital) > (price of a unit of capital)
That is, marginal revenue of product (MRP) of capital > PK
The left side denotes the increase in revenue and the right side denotes the increase in the cost of adding one more unit of labour. As long as the increment to revenues exceeds the increment to costs, the profit of the producer will increase. As we increase the units of labour, we see that MP diminishes. We assume that the prices of inputs and output do not change. In this case, as MP declines, revenues will start falling, and a point will come when the increase in revenue equals the increase in cost. At this point the producer will stop adding more units of input. With further addition, since MP declines, the additional revenues would be less than the additional costs, and the profit of the producer would decline.
Thus, profit maximization implies that a producer with no control over prices will increase the use of an input until –
Value of marginal product (MP) = Price of a unit of variable input.
Q.6. Write an essay on “Cost Concepts” that are relevant for managerial decisions. (20)
Cost Concepts
Some of the cost concepts that are frequently used in the Managerial decision making process, may be classified as follows :
1. Actual Cost and Opportunity Cost
Actual costs are those cost which a firm incurs while producing or acquiring a good or service like payment for labor, rent etc. It is otherwise known as Accounting Cost or Acquisition Cost or Outlays Cost.
Opportunity cost is the value of a resource in its next best use. It‘s the cost for the next best alternative use. The opportunity cost is really meaningful in the decision making process. Sometimes this opportunity cost, are called as alternative cost.
2. Explicit Cost and Implicit Cost
Explicit costs are those cost that involve an actual payment to other Parties. Therefore, an explicit cost is the monetary payment made by a firm for use of an input owned and controlled by others .Explicit costs are also referred to by accounting costs.
Implicit cost represents the values of foregone opportunities but do not involve an actual cost payment. Implicit cost are just as important as explicit costs but are sometimes neglected because they are not as obvious.
3. Accounting Cost and Economic Cost
Accounting costs are the actual or outlay costs. These costs point out how much expenditure has already been incurred on a particular process or on production as such.
Economic cost are concerned with what cost is expected to be in the future and how the firm might be able to rearrange its resources to lower its cost and improve its profitability. They must therefore be concerned with opportunity cost along with explicit cost. Since the only cost that matter for business decision are future costs. It is the economic costs that are used for decision making.
4. Controllable and Non- Controllable Costs
Controllable costs are those costs which are capable of being controlled or regulated by executive vigilance and therefore can be used for assessing executive efficiency.
Non-controllable costs are those which cannot be subjected to administrative control and supervision. Most of the costs are controllable, except, of course, those due to obsolescence and depreciation.
6. Out-of-Pocket Costs and Book Costs
Out-of-Pocket Costs are those costs that improve current cash payments to outsiders.
Book Costs are those business costs which do not involve any cash payments but for them a provision is made in the book of account to include them in profit and loss accounts and take tax advantages.
7. Private Costs & Social Cost
Private Costs are those that accrue directly to the individuals or firm engaged in relevant activity.
Social Costs, on the other hand are passed on to persons not involved in the activity in any direct way (i.e. they are passed on to society at large).
8. Relevant costs and Irrelevant costs
The relevant costs for decision making purposes are those costs which are incurred as a result of decision under consideration. The relevant costs are also referred to as the incremental costs. They are there main categories of relevant or incremental costs.
Q.7. What is time series analysis, cross-section analysis and engineering analysis ? What are the’ limitations of different types of statistical analysis ? (20)
Types of Statistical Analysis
Once a functional form of a production function is chosen the next step is to select the type of statistical analysis to be used in its estimation. Generally, there are three types of statistical analyses used for estimation of a production function.
These are:
1. Time series analysis
The amount of various inputs used in various periods in the past and the amount of output produced in each period is called time series data. For example, we may obtain data concerning the amount of labour, the amount of capital, and the amount of various raw materials used in the steel industry during each year from 1970 to 2000.
On the basis of such data and information concerning the annual output of steel during 1970 to 2000, we may estimate the relationship between the amounts of the inputs and the resulting output, using regression techniques.
Analysis of time series data is appropriate for a single firm that has not undergone significant changes in technology during the time span analysed. That is, we cannot use time series data for estimating the production function of a firm that has gone through significant technological changes.
There are even more problems associated with the estimation a production function for an industry using time series data. For example, even if all firms have operated over the same time span, changes in capacity, inputs and outputs may have proceeded at a different pace for each firm. Thus, cross section data may be more appropriate.
2. Cross-section analysis
The amount of inputs used and output produced in various firms or sectors of the industry at a given time is called cross-section data. For example, we may obtain data concerning the amount of labour, the amount of capital, and the amount of various raw materials used in various firms in the steel industry in the year 2000. On the basis of such data and information concerning the year 2000, output of each firm, we may use regression techniques to estimate the relationship between the amounts of the inputs and the resulting output.
3. Engineering analysis
In this analysis we use technical information supplied by the engineer or the agricultural scientist. This analysis is undertaken when the above two types do not suffice. The data in this analysis is collected by experiment or from experience with day-to-day working of the technical process. There are advantages to be gained from approaching the measurement of the production function from this angle because the range of applicability of the data is known, and, unlike time series and cross-section studies, we are not restricted to the narrow range of actual observations.
Limitations of Different Types of Statistical Analysis
1. Both time-series and cross-section analysis are restricted to a relatively narrow range of observed values. Extrapolation of the production function outside that range may be seriously misleading. For example, in a given case, marginal productivity might decrease rapidly above 85% capacity utilization; the production function derived for values in the 70%-85% capacity utilization range would not show this.
2. Another limitation of time series analysis is the assumption that all observed values of the variables pertains to one and the same production function. In other words, a constant technology is assumed. In reality, most firms or industries, however, find better, faster, and/or cheaper ways of producing their output. As their technology changes, they are actually creating new production functions. One way of coping with such technological changes is to make it one of the independent variables.
3. Theoretically, the production function includes only efficient (least-cost) combinations of inputs. If measurements were to conform to this concept, any year in which the production was less than nominal would have to be excluded from the data. It is very difficult to find a time-series data, which satisfy technical efficiency criteria as a normal case.
4. Engineering data may overcome the limitations of time series data but mostly they concentrate on manufacturing activities. Engineering data do not tell us anything about the firm’s marketing or financial activities, even though these activities may directly affect production.
5. In addition, there are both conceptual and statistical problems in measuring data on inputs and outputs.
Q.8. What is linear cost function, quadratic cost function and cubic cost function ? What are the conceptual and statistical problems in estimating such functions ?Explain. (20)
Functional Forms of Cost Function
There are three common functional forms of cost function in terms of total cost function (TC).
• Linear cost function
TC = a1 + b1Q
• Quadratic cost function
TC = a2 + b2Q + c2Q2
• Cubic cost function
TC = a3 + b3Q + c3Q2 +d3Q3
Where, a1, a2, a3, b1, b2, b3, c2, c3, d3 are constants.
When all the determinants of cost are chosen and the data collection is complete, the alternative functional forms can be estimated by using regression software package on a computer. The most appropriate form of the cost function for decision-making is then chosen on the basis of the principles of economic theory and statistical inference.
Once the constants in the total cost function are estimated using regression technique, the average cost (AC) and marginal cost (MC) functions for chosen forms of cost function will be calculated. The TC, AC and MC cost functions for different functional forms of total cost function and their typical graphical presentation and interpretation are explained below.
1. Linear cost function
TC = a1 + b1Q
AC = (TC)/Q = (a1/Q) + b1
MC = d(TC)/dQ = b1
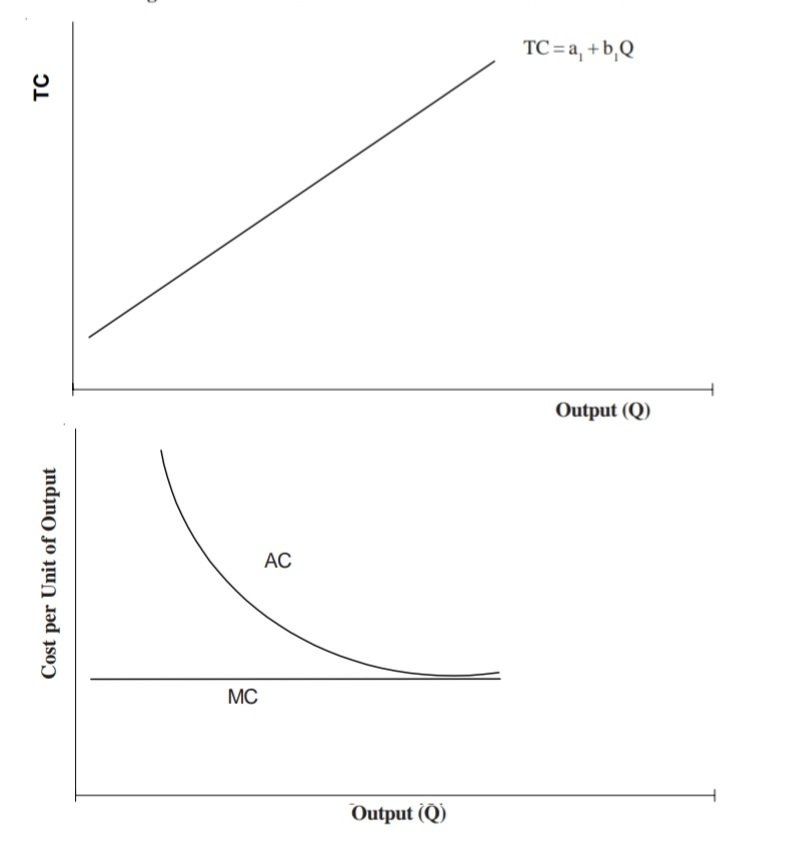 Cost Curves Based on Linear Cost Function
The typical TC, AC, and MC curves that are based on a linear cost function. These cost functions have the following properties: TC is a linear function, where AC declines initially and then becomes quite flat approaching the value of MC as output increases and MC is constant at b1.
2. Quadratic cost function
TC = a2 + b2Q + c2Q2
AC = (TC/Q) = (a2/Q) + b2 + c2Q
MC = d(TC)/dQ = b2 + 2c2Q
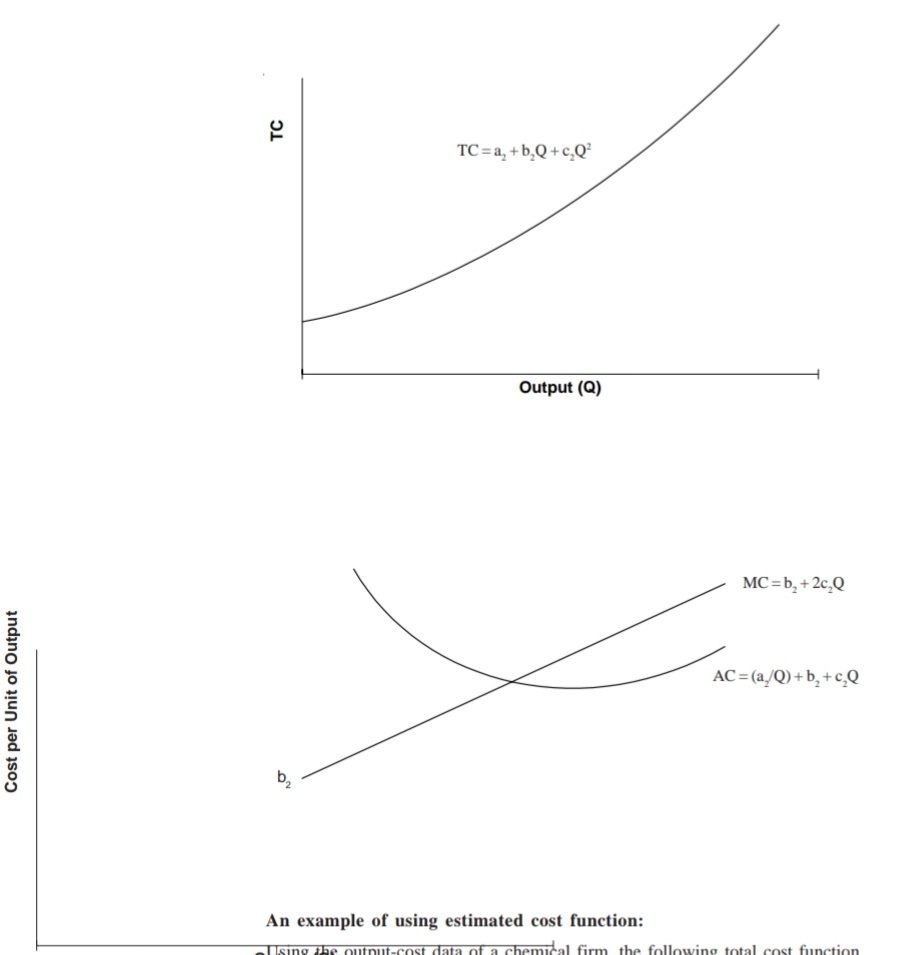 Cost Curves Based on Quadratic Cost Function
The typical TC, AC, and MC curves that are based on a quadratic cost function are shown in Figure. These cost functions have the following properties: TC increases at an increasing rate; MC is a linearly increasing function of output; and AC is a U shaped curve.
3. Cubic cost function
TC = a3 + b3Q + c3Q2 +d3Q3
AC = (TC/Q) = (a3/Q) + b3 + c3Q + d3Q2
MC = d(TC)/dQ = b3 + 2c3Q + 3d3Q2
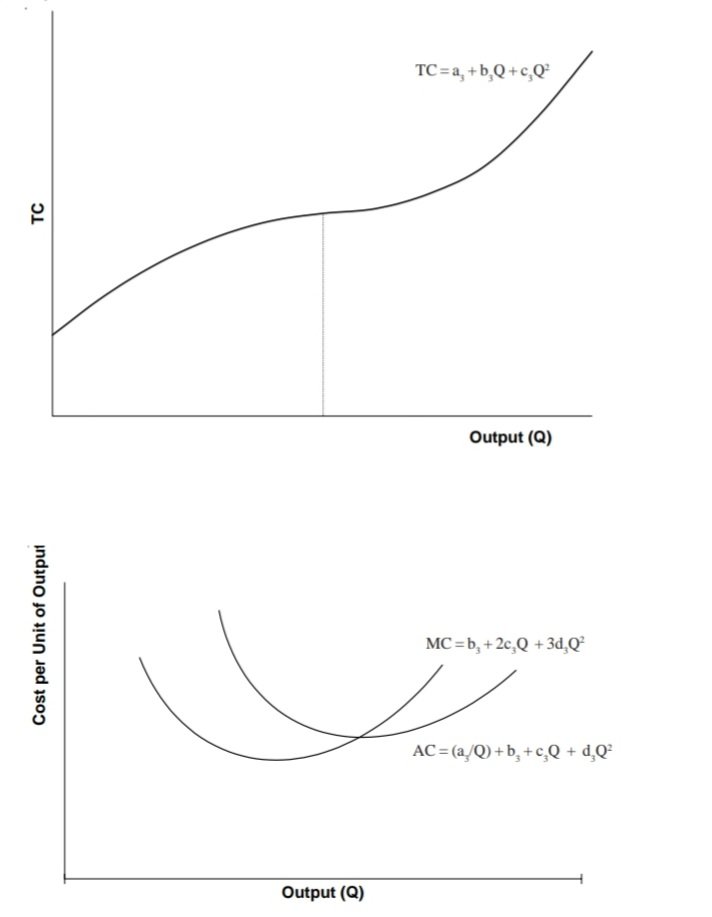 Cost Curves Based on Cubic Cost Function
The typical TC, AC, and MC curves that are based on a cubic cost function are shown in Figure. These cost functions have the following properties: TC first increases at a decreasing rate up to output rate Q1 in the Figure and then increases at an increasing rate; and both AC and MC cost functions are U shaped functions.
The linear total cost function would give a constant marginal cost and a monotonically falling average cost curve. The quadratic function could yield a U-shaped average cost curve but it would imply a monotonically rising marginal cost curve. The cubic cost function is consistent both with a U-shaped average cost curve and a U-shaped marginal cost curve. Thus, to check the validity of the theoretical cost-output relationship, one should hypothesize a cubic cost function.
Problems in Estimation of Cost Function
1. In collecting cost and output data we must be certain that they are properly paired. That is, the cost data applicable to the corresponding data on output.
2. We must also try to obtain data on cost and output during a time period when the output has been produced at relatively even rate. If for example, a month is chosen as the relevant time period over which the variables are measured, it would not be desirable to have wide weekly fluctuations in the rate of output. The monthly data in such a case would represent an average output rate that could disguise the true cost-output relationship. Not only should the output rate be uniform, but it also should be a rate to which the firm is fully adjusted. Furthermore, there should be no disruptions in the output due to external factors such as power failures, delays in receiving necessary supplies, etc. To generate the data necessary for a meaningful statistical analysis, the observations must include a wide range of rates of output. Observing cost-output data for the last 24 months, when the rate of output was the same each month, would provide little information concerning the appropriate cost function.
3. The cost data is normally collected and recorded by accountants for their own purposes and in a manner that it makes the information less than perfect from the perspective of economic analysis. While collecting historical data on cost, care must be taken to ensure that all explicit as well as implicit costs have been properly taken into account, and that all the costs are properly identified by time period in which they were incurred.
4. For situations in which more than one product is being produced with given productive factors, it may not be possible to separate costs according to output in a meaningful way. One simple approach of allocating costs among various products is based on the relative proportion of each product in the total output. However, this may not always accurately reflect the cost appropriate to each output.
5. Since prices change over time, any money value cost would therefore relate partly to output changes and partly to price changes. In order to estimate the cost-output relationship, the impact of price change on cost needs to be eliminated by deflating the cost data by price indices. Wages and equipment price indices are readily available and frequently used to ‘deflate’ the money cost.
6. Finally, there is a problem of choosing the functional form of equation or curve that would fit the data best. The usefulness of any cost function for practical application depends, to a large extent, on appropriateness of the functional form chosen. There are three functional forms of cost functions, which are popular, viz., linear, quadratic and cubic. The choice of a particular function depends upon the correspondence of the economic properties of the data to the mathematical properties of the alternative hypotheses of total cost function.
Q.9. What is “Competition” ? Discuss the factors that determine the nature competition. (20)
Competition
In economics, competition is a situation in which one company tries to be more successful than another. One business may be trying to sell more than a rival. It may also be striving to gain greater market share. Often, several companies are competing. The word refers to a race, in which the suppliers of goods or services try to beat their rivals.
In a non-business context, the word refers to a contest or rivalry involving at least two competitors. We use the term in sports, nature, science, social groups, etc. In fact, we use it in any situation in which one entity is trying to beat at least one other entity.
There are Perfect Competition, Monopoly, Oligopoly and Monopolistic Competition.
1. Perfect competition
Perfect competition is characterised by a large number of buyers and sellers of an essentially identical product. Each member of the market, whether buyer or seller, is so small in relation to the total industry volume that he is unable to influence the price of the product. Individual buyers and sellers are essentially price takers. At the ruling price a firm can sell any quantity. Since there is free entry and exit, no firm can earn excessive profits in the long run.
2. Monopoly
Monopoly is a market situation in which there is just one producer of a product. The firm has substantial control over the price. Further, if product is differentiated and if there are no threats of new firms entering the same business, a monopoly firm can manage to earn excessive profits over a long period.
3. Monopolistic competition
Monopolistic competition a term coined by E. M. Chamberlin implies a market structure with a large number of firms selling differentiated products. The differentiation may be real or is perceived so by the customers. Two brands of soaps may just be identical but perceived by the customers as different on some fancy dimension like freshness. Firms in such a market structure have some control over price. By and large they are unable to earn excessive profits in the long run. Since the whole structure operates on perceived product differentiation, entry of new firms cannot be prevented. Hence, above normal profits can be earned only in the short run.
4. Oligopoly
Oligopoly is a market structure in which a small number of firms account for the whole industry’s output. The product may or may not be differentiated. For example, only 5 or 6 firms in India constitute 100% of the integrated steel industry’s output. All of them make almost identical products. On the other hand, passenger car industry with only three firms is characterised by market differentiation in products. The nature of products is such that very often one finds entry of new firms difficult. Oligopoly is characterised by vigorous competition where firms manipulate both prices and volumes in an attempt to outsmart their rivals. No generalisation can be made about profitability scenarios.
Factors determining the nature of Competition
1. Effect of Buyers
The case where there is only one buyer. Such a situation has been referred to as monopsony. For example, there are just six firms in India manufacturing railway wagons all of which supply to just one buyer, the Railways. Such a situation can also exist in a local labour market where a single large firm is the only provider of jobs for the people in the vicinity. More frequently encountered in the Indian markets is a case of a few large buyers, defined as oligopsony. The explosive industry which makes detonators and commercial explosives, has three major customers: Coal India Ltd. (CIL), Department of Irrigation and various governmental agencies working on road building activities. Of these, just one customer, CIL takes nearly 60% of the industry’s output. There are about 10 firms in the industry, which negotiate prices and quantities with CIL to finalise their short-term plans.
Most industries manufacturing heavy equipment in India are typically dominated by a few manufacturers and few buyers with the Government being the major buyer.
2. Production Characteristics
Minimum efficient scale (MES) of production in relation to the overall industry output and market requirement sometimes plays a major role in shaping the market structure. MES is the minimum scale of output that is necessary for a firm to produce in order to take advantages of economies of scale. For example, the minimum efficient scale for an automobile firm is very high. This is intuitively appealing because if only 100 cars are produced in a capital intensive automobile plant, the average costs will be high, while a larger volume of cars will allow the fixed costs to be spread over a number of cars, thus reducing average costs and increasing the minimum efficient scale. MES for a service firm such as a travel agent will accordingly be relatively small.
3. Product Characteristics
Product differentiation is an important market characteristic because it indicates a firm’s ability to affect price. If a firms product is perceived as having unique features, it can command a premium price and the firm is said to possess market power. For example, the Rolls Royce has come to be regarded as the ultimate in automobile luxury and therefore commands a high price. Consumers are willing to pay that premium for the product. The degree of competition faced by Rolls Royce or Mercedes Benz is thus very low.
Q.10. Write short note on the following : ( 10 x 2 =20)
a. Monopoly and its characteristics
Monopoly can be described as a market situation where a single firm controls the entire supply of a product which has no close substitutes.
The market structure characteristics of monopoly are listed below:
• Number and size of distribution of sellers – Single seller
• Number and size of distribution of buyers – Unspecified
• Product differentiation – No close substitutes
• Conditions of entry and exit – Prohibited or difficult entry
Though perfect competition and monopoly are the two extreme cases of market structure, they both have one thing in common – they do not have to compete with other individual participants in the market. Sellers in perfect competition are so small that they can ignore each other. At the other extreme, the monopolist is the only seller in the market and has no competitors. The market or industry demand curve and that of the individual firm are the same under monopoly since the industry consists of only one firm.
b. Evaluation of Monopoly
Pure monopoly price will generally be greater than marginal cost and that the firm is able to generate super normal profits even in the long run. Key conditions that give rise to monopolies are economies of cale and barriers to entry. On the other hand, production processes like food processing, textiles, garments, wood and furniture, it is relatively easy to enter the market as a supplier – for example, capital requirements are low and sunk costs are also low. Many service industries like travel agencies fall into this category. In such industries, competition ensures that prices are set ‘right’ and moreover the threat of entry ensures that prices never exceed long-run average cost (for example, marginal companies in the industry cannot persistently earn above average profits). Moreover, competition also ensures that price equals long-run marginal cost. Hence the price of a good accurately reflects the opportunity cost of manufacturing it.
Problems arise from leaving everything to the market, however when a situation of monopoly occurs. In economists’ jargon, there are economies of scale to be exploited when one company meets market demand. There are typically also major barriers to entry in such industries. Most public utilities – electricity generation, water supply, gas supply and perhaps national telecommunications systems – have technologies of this sort. There are several special problems for these industries.
First, their size and capital intensity often puts particular strain on private capital markets in satisfying their investment needs. In India, in the 1990s strain was felt instead on the public coffers, and this was a major factor behind the move towards disinvestment and privatisation. Hence, while for example automobile or chemicals manufacture are also characterised by huge scale economies, governments have rarely seen it as their role to regulate companies in these industries. The question for policy makers is what to do about natural monopolies like power and water supply. Left to themselves, they will charge monopoly prices and restrict output.
The absence of any competitive threat will also probably leave such organisations wasteful, inefficient and sluggish. Since all costs can be passed on to the consumers, there will be little incentive for managers to keep them under control. Experience from, for example, the railways suggests that it will not be long before the absence of competitive pressures may damage the motives for innovation and change, so crucial in such capital-intensive sectors. Thus in some cases a regulator is appointed who must fix the natural monopolist’s price. In India, privatisation of power and telecommunications has been accompanied by the creation of a regulator, while there is no such institution for cement, automobile or chemical industry.
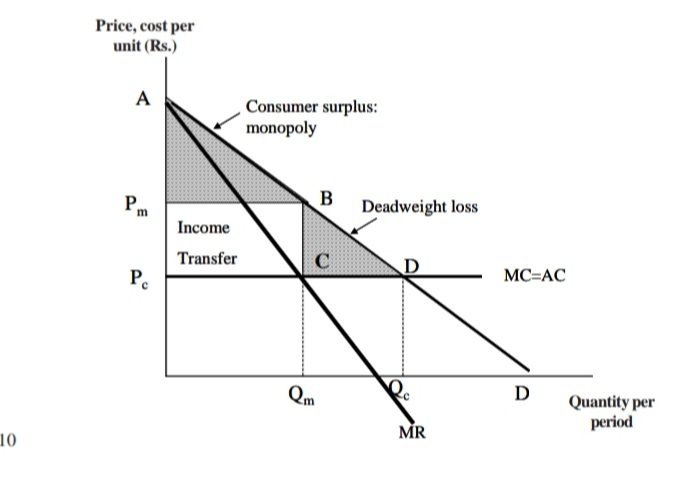
Evaluation of Monopoly
Assume a perfectly competitive industry. Price would be Pc and quantity supplied Qc. The consumer’s surplus will be the area Pc AD. Now consider output and price of the profit maximising monopolist. As indicated in the figure, price would be Pm and quantity would be Qm . Notice that the monopolist will charge a higher price and produce a lower quantity as expected. The consumer surplus is reduced to PmAB. The rectangle Pc Pm BC that was part of consumer surplus under competition is now economic profit for the monopolist. This economic profit represents income redistribution from consumers to producers. Further, there is also a deadweight loss to society represented by the area BCD that represents loss of consumer surplus that accrued under competition, but is lost to society because of lower production levels under monopoly.
If we now consider the reverse case i.e. a monopoly being broken to foster competition, the result will be transfer of income from producers to consumers and elimination of deadweight loss. Herein lies the economic basis for regulation of monopoly firms. It is to generate the outcomes of competitive markets and pass these benefits to consumers in the form of lower prices. If competition exists in markets then arguably, that is the best regulation. If it does not, and the industry is envisaged to play a social role, regulation of monopoly becomes an important policy objective.