
Table of Contents
Q.1. Describe the stages in the marketing research process. What are the major weaknesses of marketing research? (20)
Marketing research exercise may take many forms but systematic inquiry is feature common to all such forms. Being a systematic inquiry it requires careful planning of the orderly investigation process. Though it is an over simplification to assume that all research processes would necessarily follow a given sequence marketing research often follows a generalised pattern which can be broken down and studied as sequential stages.
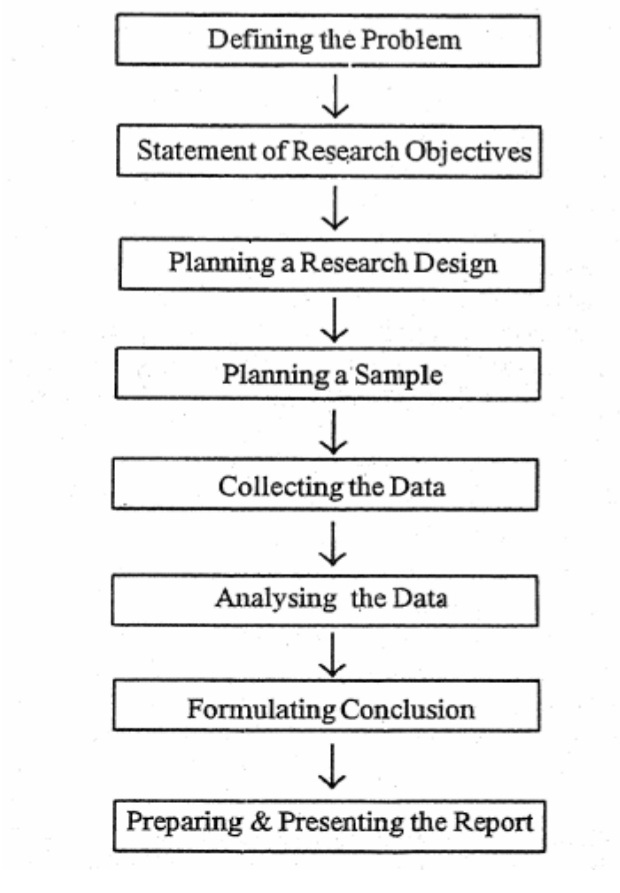 Stages in Marketing Research
1. Defining the Problem
Clear problem definition is of crucial importance in marketing research as in terms of both time and money research is a costly process. Careful attention to problem definition allows the researcher to set the proper research objectives which in turn facilitate relevant and economic data collection.
Problem definition in specific terms must precede the determination of the purpose of the research.
2. Statement of Research Objectives
After clarifying and identifying the research problem with or without exploratory research, the researcher must make a formal statement of research objectives.
Research objectives may be state in qualitative or quantitative terms and expressed as research question statements or hypothesis. For example, the research objective ” To find out the extent to which the sales promotion programmes affected sales” is a research objective expressed as a statement. A hypothesis on the other hand is a statement that can be refuted or supported by empirical findings. The same research objective could be stated as: “To test the hypothesis that sales are -positively affected by the sales promotion programme undertaken this summer.”
3. Planning the Research Design
Once the research problem has been defined and the objectives decided, the research design must be developed. A research design is a piaster plan specifying the procedure for collecting and analysing the needed information. It represents framework for the research plan of action. The objectives of the study discussed in the preceding step are included in the research design to ensure that data collected are relevant to the objectives.
4. Planning the Sample
Although the sample plan is included in the research design, the actual sampling is a separate and important stage in the research process, Sampling involves procedures that use a small number of items or parts of the population to make conclusion regarding the whole population. The first sampling question that needs to be asked is who is to be sampled, which follow from what is the target population. Defining the population may not be as simple as it seems. For example, if you are interested in finding the association between savings and loans, you may survey the people who already have accounts and the selected sample will not represent potential customers.
The researcher is also required to know how to select the various unit to make up the sample. There are two basic classes of sampling methods-probabilistic, and non-probabilistic.
5. Data Collection
The data collection process follows the formulation of research design including the sampling plan. Data which can be secondary or primary, can be collected using variety of tools. These tools are classified into two broad categories, the observation methods and the communication methods, all of which have their inherent advantages and disadvantages.
6. Data Processing and Analysis
Once the data has been collected it has to be converted to a format that will suggest answers to the problem identified in the first step, Data processing begins with the editing of data and coding. Editing involved inspecting the data collection forms for omission, legibility and consistency in classification.
Analysis represents the application of logic to the understanding of data collected about the subject. In its simplest forms, analysis may involve determination of consistent patterns and summarising of appropriate details. The appropriate analytical techniques chosen would depend upon informational requirements of the problem, characteristics of the research designs and the -nature of the data gathered. The statistical analysis may range from simple univariate analysis to very complex multivariate analysis. You will study univariate, bivariate and multivariate analysis and their applications in marketing problem in last three blocks of this course.
7. Formulating Conclusion, Preparing & Presenting the Report
The final sate in the research process is that of interpreting the information mid drawing conclusions for use in managerial decisions. The research report should effectively communicate the research findings and need not necessarily include complicated statements about the technical aspect of the study and research methods.
Often the management is not interested in details of research design and statistical analysis but in the concrete findings of the research. If executives are to act on these findings they must be convinced of the value of the findings. Researchers, therefore, must make the presentation technically accurate, understandable and useful.
Weakness of the marketing research
1. Costly
Marketing research is a costly affair. It needs a lot of money to conduct various market research activities. Huge funds are required to pay salaries, prepare questionnaires, conduct surveys, prepare reports, etc. It is not a viable choice for small businesses. It is suitable only to large companies who can afford its cost.
2. Time consuming
Marketing research is a lengthy and time-consuming process. This process involves many important steps. All these steps are crucial and not even a single step can be neglected or avoided. In other words, there are no short-cuts in MR. Generally, it takes at least three to six months to solve a marketing problem. Therefore, it cannot be used in urgent or emergency situations.
3. Limited scope
Marketing research solves many business-related problems. However, it cannot solve all business problems. It cannot solve problems related to consumer behaviour, income and expenditure relationship, etc. Thus, its scope is limited.
4. Limited practical value
Marketing research is only an academic exercise. It is mainly based on a hypothetical approach. It gives theoretical solutions. It does not give realistic solutions to real-life problems. Its solutions look good on paper but are harder to implement in a real sense. Thus, it has a limited practical value.
5. Marketing consumer behaviour
Marketing research collects data about consumer behaviour. However, this data is not accurate because consumer behaviour cannot be predicted. It keeps on changing according to the time and moods of the consumers. Consumer behaviour is also very complex. It is influenced by social, religious, family, economic and other factors. It is very difficult to study these factors.
6. No accurate results
Marketing research is not a physical science like physics, chemistry, biology, etc. It is a social science. It studies consumer behavior and marketing environment. These factors are very unpredictable. Therefore, it does not give accurate results. It gives results, but it cannot give 100% correct results.
7. Provides suggestions and not solutions
Marketing research provides data to the marketing manager. It guides and advises him. It also helps him to solve the marketing problems. However, it does not solve the marketing problem. The marketing manager solves the marketing problems. So, MR only provides suggestions. It does not provide solutions.
8. Non-availability of technical staff
Marketing research is done by researchers. The researchers must be highly qualified and experienced. They must also be hard-working, patient and honest. However, in India, it is very difficult to find good researchers. Generally, it is done by non-experienced and non-technical people. Therefore, MR becomes a costly, time-consuming and unreliable affair. So, its quality is also affected due to non-availability of technical staff.
9. Fragmented approach
Marketing research studies a problem only from a particular angle. It does not take an overall view into consideration. There are many causes for a marketing problem. It does not study all causes. It only studies one or two causes. For example, if there is a problem of falling sales. There are many causes for falling sales; like, poor quality, high-price, competition, recession, consumer resistance, etc. It will only study two causes viz; low-quality and high price. It will not study other causes. So, it is not a reliable one.
10. Can be misused
Sometimes, marketing research is misused by the company. It is used to delay decisions. It is used to support the views of a particular individual. It is also used to grab power (managerial) in the company.
Q.2. Enumerate major applications of marketing research and discuss the problems faced by an agency in doing marketing research in India. (20)
New product decisions constitute the most frequent usage of -marketing research. The other important application areas include: estimation of market share, collection of competitive information, demand estimation, product modification decisions, measurement of customer satisfaction, product positioning, diversification and market segmentation decisions. Only about one-third of the firms reported the use of marketing research for developing advertising theme/message and arriving at pricing and customer service decisions.
Application of marketing research for product elimination and evaluation of advertising effectiveness is prevalent only among 20 per cent firms. Furthermore, on, 9 per cent firms reported the incidence of marketing research for channel modification decisions,
Applications of Marketing Research in India –
• New product decisions
• Estimating market share
• Gathering competitive information
• Demand estimation
• Product modification decisions
• Measuring consumer satisfaction
• Product positioning decisions
• Diversification decisions
• Market segmentation decisions
• Advertising theme/message decisions
• Pricing decisions
• Customer service decisions
• Product elimination decisions
• Evaluating advertising effectiveness
• Channel modification decisions.
Problems in conducting market research in India
Due to country’s vast size, heterogeneous population and infrastructural and attitudinal problems, it is not easy to conduct marketing research in India.
• India’s large and heterogeneous population comes in a big way in conducting marketing research. Being a big and diverse country, national surveys require India to be divided into several hundred districts and interviewing several thousands of people. This calls for enormous time and money and a big fleet of field workers -well beyond the capacity of any small or medium size company.
• Cultural diversity and linguistic nuisances further compound the researcher’s problem. More than 14 languages are spoken in the country, with dialects exceeding 1,400 in number. Any major survey in the country requires translation of the questionnaire in a minimum of five to six languages. Many a time, strict translation of certain technical words or phrases is not possible, thus giving rise to the problem of non- comparability of data across the regions.
• Accessibility to people living in the hinterland of the country is another big problem. Only very few people own telephone. Postal system is also not up to the mark: Because of low literacy level, mail interviews are of limited application. Personal interviews seem to be the only viable alternative, but even these are beset with transport problems and lack of trained staff in the small towns and rural areas.
• Secondary data available in the country also suffer on account of poor coverage and redundancy of information. Data are at all not available for many a variable of interest to the researchers. Though census is conducted after every ten yews in the country, it is after a considerable lapse of time that the full results are released. Even the trade and industry associations: lack complete and up-to-date lists of the manufacturers and trades. The industry and firms’ production and sales figures are also not complete, up-to-date and reliable.
• Use of random and other elaborate sampling techniques presuppose the existence of suitable sampling frames (i.e., list of the target market population from which the samples are drawn ). Non-availability of such lists in the country complicates the research tasks and forces the researcher to use non-probability sampling methods, thus adversely affecting the reliability and validity of the survey results.
• Attitudinal problems also restrict the us of marketing research in India, The study by, Consulting and Research Enterprise (CORE) group, for instance, found that only two-third of the executives of the surveyed firms had the opinion that marketing research findings represent the real world, and marketing research data are reliable cough to be of use, decision making. In response to the question whether costs incurred on marketing research are low relative to the benefits that accrue from it, about 58 per cent firms indicated disagreement, implying low utility of marketing research. Further only 57 per cent of the executives refuted the statement that “gut feeling is more important than marketing research”. Rest were either ambivalent or in agreement with the statement.
• The managers also appeared quite concerned with the time involved in completing the marketing research studies. Only 42 per cent of the respondents did not feel that “market research often takes too long to be of any real use”. In terms of quality and sophistication too, marketing research in India in the opinion of many executives is far below the expectations.
Q.3. Describe the various kinds of research designs and their applications for different research situations. (20)
A research design is a broad plan that states objectives of research project and provides the guidelines what is to be done to realize those objectives. It is, in other words, a master plan for executing a research project.
Types of Research Designs
The research design is a broad framework that describes how the entire research project is carried out. Basically, there can be three types of research designs – exploratory research design, descriptive research design, and experimental (or causal) research design. Use of particular research design depends upon type of problem under study.
1. Exploratory Research Design
This design is followed to discover ideas and insights to generate possible explanations. It helps in exploring the problem or situation. It is, particularly, emphasized to break a broad vague problem statement into smaller pieces or sub-problem statements that help forming specific hypothesis.
The hypothesis is a conjectural (imaginary, speculative, or abstract) statement about the relationship between two or more variables. Naturally, in initial state of the study, we lack sufficient understanding about problem to formulate a specific hypothesis. Similarly, we have several competitive explanations of marketing phenomenon. Exploratory research design is used to establish priorities among those competitive explanations.
The exploratory research design is used to increase familiarity of the analyst with problem under investigation. This is particularly true when researcher is new in area, or when problem is of different type.
This design is followed to realize following purposes:
1. Clarifying concepts and defining problem
2. Formulating problem for more precise investigation
3. Increasing researcher’s familiarity with problem
4. Developing hypotheses
5. Establishing priorities for further investigation
Exploratory research design is characterized by flexibility to gain insights and develop hypotheses. It does not follow a planned questionnaire or sampling. It is based on literature survey, experimental survey, and analysis of selected cases. Unstructured interviews are used to offer respondents a great deal of freedom. No research project is purely and solely based on this design. It is used as complementary to descriptive design and causal design.
2. Descriptive Research Design
Descriptive research design is typically concerned with describing problem and its solution. It is more specific and purposive study. Before rigorous attempts are made for descriptive study, the well-defined problem must be on hand. Descriptive study rests on one or more hypotheses.
For example, “our brand is not much familiar,” “sales volume is stable,” etc. It is more precise and specific. Unlike exploratory research, it is not flexible. Descriptive research requires clear specification of who, why, what, when, where, and how of the research. Descriptive design is directed to answer these problems.
3. Causal or Experimental Research Design
Causal research design deals with determining cause and effect relationship. It is typically in form of experiment. In causal research design, attempt is made to measure impact of manipulation on independent variables (like price, products, advertising and selling efforts or marketing strategies in general) on dependent variables (like sales volume, profits, and brand image and brand loyalty). It has more practical value in resolving marketing problems. We can set and test hypotheses by conducting experiments.
Test marketing is the most suitable example of experimental marketing in which the independent variable like price, product, promotional efforts, etc., are manipulated (changed) to measure its impact on the dependent variables, such as sales, profits, brand loyalty, competitive strengths product differentiation and so on.
4. Correlational research design
Correlational research is a non-experimental research design technique that helps researchers establish a relationship between two closely connected variables. This type of research requires two different groups. There is no assumption while evaluating a relationship between two different variables, and statistical analysis techniques calculate the relationship between them.
A correlation coefficient determines the correlation between two variables, whose value ranges between -1 and +1. If the correlation coefficient is towards +1, it indicates a positive relationship between the variables and -1 means a negative relationship between the two variables.
5. Diagnostic research design
In diagnostic design, the researcher is looking to evaluate the underlying cause of a specific topic or phenomenon. This method helps one learn more about the factors that create troublesome situations.
This design has three parts of the research:
• Inception of the issue
• Diagnosis of the issue
• Solution for the issue
Q.4. Discuss the important sources of error in both secondary and primary data. (20)
Sampling error as the name implies is inherent in the procedure of sample chosen and results in the sample becoming non-representative of the population.
For example, in order to study the patterns of cigarette consumption among Indian males if you chose a sample of college student in a metropolitan city, this sample would not representative of the population of males in India. The study that you conduct on this sample, no matter which tool of data collection you use, would not be valid because it suffers from sampling error. The range of sampling error however can be controlled by changing the characteristics of sample drawn. Moreover, the extent of the sampling error can be measured if we take a. probability sample. More about sampling error has been discussed in the next unit on sampling.
A non-response error occurs when a unit (unit here may be an individual, a family or an establishment) included in the sample, cannot or has not been reached.
For example, in a sample of housewives from a particular city area, if a number of them happen to be away everytime the interviewer chooses to come, non-response is likely to occur. Incidence of non-response error as already noted is very high in mail interviews as respondents simply ignore the questionnaire received by them..
In most direct structured interviews i.e. surveys involving use of questionnaires, non-response bias is a sizeable error. It may affect completeness as well as objectivity in data collection as families who cannot be reached after certain attempts during the day may be significantly different from those which can be easily contacted. The non-response error is a serious matter because the direction of the error is generally unknown. One can assume that the non response respondents would each have responded in a given way and therefore can determine the maximum error due to non-response but it is difficult to measure the magnitude of the error. One simple way of minimising this error would be to fix up an appointment before the interview but specially in a country like ours where a large number of respondents do not have access to the telephone, this may not be very practicable.
Response error occurs when the value of the reported variable differs from the actual value of that variable. We world here include errors of both communication and observation.
Inaccurate information due to the investigator
The most common cause of this type of inaccuracy is cheating by the interviewer. There are a number of way in which interviewers deliberately obtain inaccurate information and supply it. If the questionnaire, happens to contain a question that the investigator finds embarrassing to ask, he may decide to supply his own answer or supply an inference on what the respondents answer would have been. In extreme cases reports of interviewees’ without ever having contacted the interviews have been discovered to be submitted. Another in between situation that is found to exist is that interviewers get their own friends and associates to fill in the questionnaire or respond to a direct interview amid list the responses in the names of the people listed in the sample, thus vitiating the entire sampling exercise.
Experienced marketing research agencies feel that like other petty forms of cheating, interviewer cheating can only be controlled to lower its incidence, it can never be eliminated completely. Care in selection, training and supervision of interviewers can and does help in controlling the incidence of cheating. In addition, certain control procedures like cross checking of small samples of respondents and use to cheater question which disclose the fabricated answers with a fairly high success rate are employed to minimise the incidence of interviewer generated inaccuracy.
Ambiguity
Ambiguity which is defined as errors made in interpreting behaviour or words spoken or written is source of error which occurs in both, communication and observation methods of data collection. All languages are capable of being ambiguous as the person transmitting information and the person receiving them are two different people and the interpretation of the question/behaviour may differ from one person to another.
Q.5. Describe in brief the importance of editing, coding, classification, tabulation and presentation of data in the context of research study. (20)
Data required for the purpose of analysis & presentation of a research study is often consisting of errors such errors must be rectified before the final presentation is made.
This process involves editing, coding, classification, tabulation & presentation of data.
1. Editing
This is concerned with removal of redundant data, filling of missing data completeness of data substance & reliability of data. The data obtained from variance sources are not always complete-sometimes fields remain black due to the human errors also this requires to be corrected. It also corrects the entries present at wrong positions. Many techniques like filling the empty values by frequent values, average values, random value, lowest value etc are common. The editing must be performed just after the data have been collected. This ensures that consistency is maintained various details like editor. data of editing etc are recorded.
Information gathered during data collection may lack uniformity. Example: Data collected through questionnaire and schedules may have answers which may not be ticked at proper places, or some questions may be left unanswered. Sometimes information may be given in a form which needs reconstruction in a category designed for analysis, e.g., converting daily/monthly income in annual income and so on. The researcher has to take a decision as to how to edit it.
Editing also needs that data are relevant and appropriate and errors are modified. Occasionally, the investigator makes a mistake and records and impossible answer. “How much red chilies do you use in a month” The answer is written as “4 kilos”. Can a family of three members use four kilo chilies in a month? The correct answer could be “0.4 kilo”.
2. Coding
Coding is performed to assign a predefined meaning to the data captured. The records that satisfy a given constraints are often marked with some Alphabets numerals etc. so that while sorting. Searching such records are taken out by a single search command. This concept is mutually exclusive.
Now-a-days, codes are assigned before going to the field while constructing the questionnaire/schedule. Pose data collection; pre-coded items are fed to the computer for processing and analysis. For open-ended questions, however, post-coding is necessary. In such cases, all answers to open-ended questions are placed in categories and each category is assigned a code.
Manual processing is employed when qualitative methods are used or when in quantitative studies, a small sample is used, or when the questionnaire/schedule has a large number of open-ended questions, or when accessibility to computers is difficult or inappropriate. However, coding is done in manual processing also.
3. Classification
This step of data sorting involves the segregation of data into various classified forms. The step of-classification makes the data analysis easy often a research study conducted. Serves not only single but multiple purposes. The various departments in organisation are interested in different aspects of the same data collected by the researches. These data correspond to the various form of analysis to make a particular decision. Data classification helps in making-comparisons & design strategies & policies for future action classification is performed accounting to various criterias like year wise, caste wise income group wise, department wise etc. During the problem study itself the classification criteria must be mentioned. Data classified into various forms may be further summed up to form an aggregated plan & even the aggregated data may be drilled down to achieve the desired results as per specifications.
Sarantakos (1998: 343) defines distribution of data as a form of classification of scores obtained for the various categories or a particular variable. There are four types of distributions:
1. Frequency distribution
2. Percentage distribution
3. Cumulative distribution
4. Statistical distributions
4. Tabulation
Classified data is presented in the form of rows & columns called tables. Such an approach is helpful for sorting, indexing, searching, aggregating & performing all sorts of operations leading to the data bank. This is further used for performing what if analysis. They present data clearly & to the point. The table must have row & column name to identify what the table represents. There must also be table names & headings for proper presentation Table also help to perform joining of two data sources. There must be appropriate messages attached to the cells, column, Page header & footer to allow easy referencing. Table hence designed must present simple, accurate & clear picture of the conclave to be displayed. The table designed must be able to fulfil the basic criteria for which if were designed.
Table can be prepared manually and/or by computers. For a small study of 100 to 200 persons, there may be little point in tabulating by computer since this necessitates putting the data on punched cards. But for a survey analysis involving a large number of respondents and requiring cross tabulation involving more than two variables, hand tabulation will be inappropriate and time consuming.
Usefulness of tables:
Tables are useful to the researchers and the readers in three ways:
1. The present an overall view of findings in a simpler way.
2. They identify trends.
3. They display relationships in a comparable way between parts of the findings.
By convention, the dependent variable is presented in the rows and the independent variable in the columns.
5. Presentation
Data available in table in form of facts & figures are also presented in the form of the charts, pictorial graphics, picture analysis-graphics etc. This helps the top management to perform an effective data decision presentation is in the form of presentation is in the form of Graphics, pictorial. Pie charts etc. These are” tools for top managements for an accurate data interpretations.
Q.6. Write short notes on: (10×2=20)
a. Sales Promotion Campaign
It is not necessary that one should always use analytical tools of marketing research which a great deal of sophistication. Even analysis involving simple arithmetic and descriptive statistics can bring the essence and lead to effective decisions. What is important is conceptualisation of the problem with clarity of thought. The present illustration will bring out this fact.
Sales promotion consists of a wide variety of tactical promotion tools of a short term incentive nature, designed to stimulate strong target market response. Among the more popular ones are premiums, couponing, contests, incentives and deals.
Sales promotion in the marketing mix assumes greater importance due to emergence of new product, growth of self service retailing, and heightened competition.
Evaluation of a sales promotion programme depends upon the nature of the product viz’, consumer or industrial, objectives set forth like greater market share or sustaining the market share if the product is a matured one, nature of the market and competitive conditions. Evaluation may involve comparing the targets with the actual where the targets aimed at are based on the promotion scheme, or comparing the market share before the sales promotion, immediately after the promotion and say 6 months after the promotion.
Example of Sales Promotion Campaign
We will evaluate “sales promotion programme (SPP) of a consumer product launched by Richardson Hindustan Limited (RHL now P&G India Ltd.) during winter 1981-82.
The product is VICKS VAPORUB’.
Objectives
The main objectives of the sales promotion programme campaigns were :
1. To achieve large scale jar upgrading with a view to sustaining the overall market share,
2. To encourage consumers to buy VICKS VAPORUB,
3 To sample Inhaler to new users and hence develop an independent inhaler franchise, and
4. To sample Vicks cough drops.
b. Media Research
Media research is the study of the social, psychological and physical aspects and effects of the different mass media. For example, how much time do people spend with a particular medium? Whether it has the effect of bringing about changes in the perspectives of people? Does the use of medium have any harmful effects? Whether these effects are because of technology or the programme contents. What the media users want and expect to hear or read or see and experience?
In this connection it is also researched whether a medium can provide information and entertainment to more and different types of people. In what way, new technology can be used to improve or enhance the sight or sound of the medium? How is it possible to change the content or programming to make it more valuable effective and entertaining?
Media research includes a whole range of study about the development of media, their achievements and effects. It includes the methods used in collecting and analysing information with regard to newspapers, magazines, radio, TV, Cinema or other mass media. It also concerns with an expanded discussion of the scientific methods of research. While studying any medium of communication we may ask series of questions.
• What is the nature of the medium?
• How does it work?
• What technology does it involve
• How is it different or similar to any other media in any ways
• What function and/or services does it provide?
• How much does it cost?
• Who will have access to the new medium?
• Is this medium effective?
• Can its performance be improved?
Media research also accumulates information about the uses of the mass media and also the users of the mass media. In this connection we may ask:
• How the people use a medium or the various media?
• Whether it is used for information only and/or for entertainment and education also?
• Which category of people use the different media more and why?
• What gratification do the media provide?
• What types of uses the media are put to?
A lot of media related research is done for practical application purposes. From the fifties and sixties, advertisers have been using media research to devise ways to persuade potential customers to buy products and services. As a result, a large number of media studies were conducted on message effectiveness. Demography, and size of audience, role of advertising in achieving higher degree of acceptance and sell, frequencies of message to persuade potential customers and selection of media that best suited to reach the target audience were some of the advertising related media research areas.
In recent years, mass media research included the various psychological and sociological aspects of mass media. For example, many studies are conducted on the psychological and emotional responses to television programmes and music played and broadcast by radio and television.
Today in media research, computer modelling and other sophisticated computer analysis including multimedia applications have become commonplace.
Q.7. Explain the concept of Association that takes place between a dependent variable and a set of independent variables. (20)
The concept of Association that takes place between a dependent variable and a set of independent variables are –
1. Analysis of Variance
Analysis of variance (ANOVA) is a collection of statistical models and their associated estimation procedures (such as the “variation” among and between groups) used to analyze the differences among group means in a sample. ANOVA was developed by the statistician Ronald Fisher. The ANOVA is based on the law of total variance, where the observed variance in a particular variable is partitioned into components attributable to different sources of variation. In its simplest form, ANOVA provides a statistical test of whether two or more population means are equal, and therefore generalizes the t-test beyond two means.
ANOVA is a form of statistical hypothesis testing heavily used in the analysis of experimental data. A test result (calculated from the null hypothesis and the sample) is called statistically significant if it is deemed unlikely to have occurred by chance, assuming the truth of the null hypothesis. A statistically significant result, when a probability (p-value) is less than a pre-specified threshold (significance level), justifies the rejection of the null hypothesis, but only if the a priori probability of the null hypothesis is not high.
2. Regression Analysis
Regression analysis is a powerful statistical method that allows you to examine the relationship between two or more variables of interest.
While there are many types of regression analysis, at their core they all examine the influence of one or more independent variables on a dependent variable.
Regression analysis is a reliable method of identifying which variables have impact on a topic of interest. The process of performing a regression allows you to confidently determine which factors matter most, which factors can be ignored, and how these factors influence each other.
3. Discriminant Analysis
Discriminant analysis is statistical technique used to classify observations into non-overlapping groups, based on scores on one or more quantitative predictor variables.
For example, a doctor could perform a discriminant analysis to identify patients at high or low risk for stroke. The analysis might classify patients into high- or low-risk groups, based on personal attributes (e.g., cholesterol level, body mass) and/or lifestyle behaviours (e.g., minutes of exercise per week, packs of biscuits per day
4. Factor Analysis
Factor analysis is a statistical method used to describe variability among observed, correlated variables in terms of a potentially lower number of unobserved variables called factors. For example, it is possible that variations in six observed variables mainly reflect the variations in two unobserved (underlying) variables. Factor analysis searches for such joint variations in response to unobserved latent variables. The observed variables are modelled as linear combinations of the potential factors, plus “error” terms. Factor analysis aims to find independent latent variables.
The theory behind factor analytic methods is that the information gained about the interdependencies between observed variables can be used later to reduce the set of variables in a dataset. Factor analysis is commonly used in biology, psychometrics, personality theories, marketing, product management, operations research, and finance. It may help to deal with data sets where there are large numbers of observed variables that are thought to reflect a smaller number of underlying/latent variables. It is one of the most commonly used inter-dependency techniques and is used when the relevant set of variables shows a systematic inter-dependence and the objective is to find out the latent factors that create a commonality.
Factor analysis is related to principal component analysis (PCA), but the two are not identical. There has been significant controversy in the field over differences between the two techniques (see section on exploratory factor analysis versus principal components analysis below). PCA can be considered as a more basic version of exploratory factor analysis (EFA) that was developed in the early days prior to the advent of high-speed computers. Both PCA and factor analysis aim to reduce the dimensionality of a set of data, but the approaches taken to do so are different for the two techniques. Factor analysis is clearly designed with the objective to identify certain unobservable factors from the observed variables, whereas PCA does not directly address this objective; at best, PCA provides an approximation to the required factors. From the point of view of exploratory analysis, the eigenvalues of PCA are inflated component loadings, i.e., contaminated with error variance.
Q.8. What are the steps involved in conjoint analysis? Explain with the help of examples from hospitality industry. (20)
The main steps involved in the application of Conjoint Analysis are following:
1. Identification of Salient Attributes
Unlike MDS or Factor Analysis, Conjoint Analysis requires the salient attributes to be given. These attributes can be selected based on the marketer’s experience, depth interviewing or Focussed group discussions. In some cases Factor Analysis or MDS may also be used for labelling the salient factors. Only those attributes should be selected here around which differences do exist among brands or through which future differentiations can be achieved. For, if it is not possible to differentiate products along any particular attribute, the managerial value of that attribute becomes very low.
2. Assignment of levels to selected attributes
The real products can be described as specific combinations of the attributes where each attribute can take different values. Sometimes the attribute can take only discrete values. Examples of such attributes may be brand name , colour of the product or the nature of technology used. Out of the entire range of values that may be theoretically possible, the marketer may choose only a few for his active consideration. For example, a soap can technically be produced in all colours. But, some colours, like dark black, may be ruled out.
Some attributes, like price or life of the product, may take continuous values. Conjoint Analysis can treat them or like that also. Some range of values may be specified for them or the range may be kept open ended.
3. Fractional Factorial Design of Experiment
In Conjoint Analysis the profile of different products are presented to the consumers for their responses. These profiles are generated by varying the levels of its attributes.
The statistical technique of Fractional Factorial Design of Experiment finds out the minimum number of product designs which are necessary to use in the study and yet provide us all the information that we originally sought. These designs are also mutually independent (orthogonal) to avoid any redundancy in the data and allow the representation of each of the attributes and their respective levels in an unbiased manner.
4. Physical design of stimuli
After selecting the product concepts required for the Conjoint Analysis study, they need to be exposed to the consumers as stimuli. This may be done in a variety of ways mainly depending on the demands of the situation and the convenience of the researcher. Of course, it would be most desirable to present real life prototypes of the products according to the product concepts specified. These, may be given to the consumers for their usage or trials. But, such extreme ways of presenting the products may not always be possible or even necessary. In such cases, product models, diagrams or even verbal descriptions may be adopted. In our example of dish washers, it may not be possible to produce the 16 prototypes and take them to the consumers. Just their models or pictures may be sufficient.
5. Data Collection
Ease of data collection is a key feature of Conjoint Analysis. The consumers are asked only to assign rating scores to each of the product stimuli or even rank the ‘different concepts presented to them. This is quite, a realistic task and is close to the shopping experiences where the customer merely makes choices. He does not have to respond to each of the attributes separately.
This feature of conjoint analysis is possible due to the use of Fractional Factorial Design of Experiment before collection of data and the use of Conjoint Analysis after collecting the data. In other words, the use of the technique eases the burden of the respondents.
6. Determination of part worth utilities
The rating or ranking data obtained from the consumers are analysed next. Two methods are more popular for this purpose. In one method, the part worth utilities for each of the levels of each attributes are arbitrarily assigned. Based on these assumed values, consumers overall rating or ranking (as the case may be) are estimated. These estimated responses may, understandably, be quite different from the actual data.
After a few iterations convergence is achieved so that the part worth utilities found approximate the estimate responses to the actual data best.
7. Conjoint Analysis applications
Calculation of the part worth utilities becomes just the starting point for many interesting applications of conjoint analysis: The important ones among them are described next:
a. Optimum Product Design
Since all possible product concepts can be compared after adding their respective attribute levels part worth utilities, it is possible to determine the demand for different products out of any given set of available products in the marketplace. The demand levels can be converted into profit figures as cost of producing and marketing can also be calculated. These cost calculations are possible as the volume of operations and the features of the products are now known. Thus, the optimum product can be chosen from the profits point of view (or any of the other given management’s objective). Customers differential rates of purchase of products are also duly considered at this stage.
b. Market segmentation
Since the Conjoint Analysis is done at the individuals customer level, the individual customer’s identity can be retained throughout the analysis. Thus, consumers can be segmented according to their sensitivities to different product attributes.
c. SWOT Analysis
First of all, the part worth utility of the brand itself can tell about the relative brand strength. Similarly by looking at the other features of one’s own and competitor’s offers Conjoint Analysis enables the marketers to conduct his detailed SWOT analysis.
d. Estimating Customer Level Brand Equity
Conjoint Analysis is a good Conjoint Analysis bridge between the consumer level perceptions and the financial worth of the offers. This can be used for estimating the important parameter of brand equity at the consumers level. There is scope of differentiating the “Loyal”, “Acceptors” and “Switchers” for more accurate calculations of brand equity.
Q.9. Write an essay on ‘Application of multi-dimensional scaling’. (20)
Some of the typical marketing applications that emerge from the Multi Dimensional Scaling technique are
1. Market Segmentation
Market segmentation is the technique of trying to identify groups of consumers who exhibit commonality of perception of products and preferences, One can use MDS techniques to identify present perceptions of products by consumers, and use it modify the company’s product, package, advertising, additional features, so that the product offering of the company moves more and more closer to the `ideal’ requirement of the consumer.
2. Advertisement Evaluation
The MDS technique could be used at the stage of advertisement pre-testing. Once an advertisement has been developed, it could ‘be tested for similarity/dissimilarity with other advertisements in the same product category. As the ultimate objective of an advertisement is to communicate, with the target consumer effectively, and this is. possible only if the advertisement is distinct in its message from the other competing advertisements,
3. Product Re-positioning Studies
If &-company is interested in re-positioning its product/service (in the mind of the consumer), the first and foremost activity to be done is to assess the. current perception of the product in the mind of the consumer. The classic re-positioning case is that of Cadbury chocolates, which kept on assessing its positioning platform, and successfully moved Chocolates from a product perceived. as one for children, to a product which could be consumed by a person of any age,, at any time, of the day, and for varied occasions.
4. New Product Development
MDS technique shows us the various perceived perceptions of the different brands. Spaces/ Gaps in the product perceptions could be used’ to, develop new offerings for the target consumer.
5. Test Marketing
MDS technique can be used to identify cities that have similar demographic characteristics, and one could then identify a city which could represent a national character, and use that city for test marketing. One can thus `observe that MDS is a very useful technique to help understand the market place and develop strategies for the future.
Advantage of Multi Dimensional Scaling
The advantage of NOS methods is not in the measurement of physical distances, but rather “psychological distances”, also called as `dissimilarities’. In MDS, we assume that every individual pawn has a ‘metal map’ of products, people, places, events, companies, and individuals keep on evaluating their external environment on a continuous basis.
We also assume that the respondent is able to provide either numerical measure of his or her perceived degree of similarity/dissimilarity between pairs of objects, or can rank pairs of objects (ordinal scale of measurement) in terms of similarity/dissimilarity to each other.
We can then make use of methodology, of MDS to construct a physical map in one or more dimensional whose inter-point distances (or ranks of distances) are most consistent with input data.
Now-a-days a number of software programmes are available for conducting MDS analysis. These programmes provide for a variety of input data. Some of the widely used softwares include MDPREF, MDSCAL SM, INDSCAL, PREFMAM, PROFIT, KUST.
Q.10. Write short notes on: (10×2=20)
a. Factor Analysis
Factor analysis explains a pattern of similarity between observed variables. Questions which belong to one factor are highly correlated with each other; unlike cluster analysis, which classifies respondents, factor analysis groups variables.
There are two types of factor analysis in marketing research: exploratory and confirmatory. Exploratory factor analysis is driven by the data, i.e. the data determines the factors. Confirmatory factor analysis, used in structural equation modelling, tests and confirms hypotheses.
Factor analysis in market research is often used in customer satisfaction studies to identify underlying service dimensions, and in profiling studies to determine core attitudes. For example, as part of a national survey on political opinions, respondents may answer three separate questions regarding environmental policy, reflecting issues at the local, regional and national level. Factor analysis can be used to establish whether the three measures do, in fact, measure the same thing.
It can also prove to be useful when a lengthy questionnaire needs to be shortened, but still retain key questions. Factor analysis indicates which questions can be omitted without losing too much information.
Factor analysis is a statistical technique in which a multitude of variables is reduced to a lesser number of factors. In the marketing world, it’s used to collectively Analyze several successful marketing campaigns to derive common success factors. This, in turn, helps companies understand the customer better.
Factor Analysis & Its Applicability
Factor analysis is used to observe correlated variables and deduce the variability among them by describing it with a few unobserved ‘factors.’ The idea is that the data gathered by observing existing variables can be used to reduce sets of variables in any dataset. That’s why it’s primarily used in machine learning as a method of assisted data mining. Factor analysis is used in fields such as finance, biology, psychology, marketing, operational research, etc.
For example, during inquiries about consumer satisfaction with a product, people may respond similarly to questions about that product’s utility, price, and durability. In any research, the factors and variables are equal in number. Each factor notices a certain variance in each of the observed variables. The ‘eigenvalue’ shows how much variance is observed by a factor. An eigenvalue greater than 1 shows that there is variance in more than one variable on part of the factor.
b. Methods of Qualitative research.
1. Individual ‘Depth’ or ‘Intensive’ Interviews
The in-depth interviews could be classified as:
• Non-directive interview
• Semi-structured or focussed interview.
In a non-directive intend:- v, the respondent is given maximum freedom to respond in a manner that he wishes to, within a reasonable limit of relevancy to the topic under discussion. However, the interviewer retains the initiative in the interview process, else the focus of the interview would be lost. Thus, with this technique, the respondent is given a chance to freely express his ideas and thoughts, which acts as an important feedback to the company regarding the company’s’ products/service.
In a semi-structured or focussed interview, the initiative is retained by the interviewer, and the interview has to cover specific list of points, which has been decided in advance. There is also a tighter control over the interview, in order to maximise data collection and also collect data relevant to the topic under consideration. The interviewer also has determined as to which questions are to be asked. The best example to highlight this interview process is the chat shows that take place on television. Even though the participant(s) is/are given maximum freedom with respect to his/her answers, the initiative is retained by the interviewer, and he/she has decided in advance the questions that would be asked in the e. nurse of the interview.
2. Focus-Group Discussion
There are broadly two ways in which a group discussion can be conducted:
a. Brain-Storming
In such a method, there is no moderator for the group, and the group freely expresses its ideas on the given topic. The ideas could be absolutely abstract, but then this would help in generating new product ideas and also better ways of conducting a particular business etc. In this, use is made of tape-recorder to record the group discussion, video-taping of proceedings is also done in order to record the facial expressions of the, participants, as also the intensity of their feelings.
b. Focussed Group Discussion
In such a method, the group is given a topic and asked to discuss the topic. A moderator would also be involved in order to ensure that the group ‘discussion remains relevant and does not go off the track.
The moderator could stop the, discussion between time intervals to find out what conclusions are being drawn by the group after each time interval.
Size and Composition of a Group Discussion Panel
There is no correct size prescribed for a Group Discussion. The size of the group depends upon (a) the subject matter under discussion. (b) the type of participants. Normally, 8 to 12 individuals in a group discussion panel is an ideal size.
3. Projective Techniques
When a researcher is conducting an in-depth interview, or conducting a survey through the questionnaire method, he might face problems in the form of language barriers with the respondent, or illiterate respondent (especially in social research and rural research), or social barriers (respondent is embarrassed to talk about a topic) or psychological barriers (recall of event or feelings at that moment of interview is not there or trying to avoid certain questions or “can’t say” answer). In order to overcome such barriers faced during an interview process, the researcher may replace the questionnaire with the projective techniques.
The following are the different types of projective techniques:
a. Word Association Test
In this method, the respondent is presented with a list of stimulus words, and for each word, is asked to respond with what he thinks about the word. The respondent is not given time to think of the responses. The ideas is that the `first thought’ responses are likely to reveal the true feelings of the respondent about the stimulus.
b. Sentence Completion Test
This is an extension of the word association test. In this method, the respondent is asked to finish an incomplete sentence with the first thought that comes to his mind. The idea is that the respondent projects his own feelings into the sentence.
c. Fantasy Situation
Here, the respondents are asked to imagine that they are converted into a product itself e.g., car, box of chocolate. This leads to the respondent imagining himself to be product itself and give the human characteristics to the product. This method is used for developing brand perception, brand personality.
d. Cartoon Completion
In this method the respondent is shown a cartoon that is similar to a comic strip, with “balloons” indicating speech. Usually, two people are shown talking to each other about a particular product/service/situation, but only one balloon contains the speech.
The situation that is shown in the cartoon is obviously of special interest to the researcher, and is part of the research project under hand. The respondent has to fill the other `balloon’ with his answer to what the other person is saying.
With this one tries to measure attitude towards a product or service. Analysis and interpretation of these results are highly subjective.
e. Picture Interpretation (Thematic Apperception Test)
Thematic Apperception Test (TAT), along with the Rorschach Inkblot test, is probably the most widely known and used projective technique in Clinical Psychology. The same basic technique used above is applied for marketing research-applications.
Here, the respondent is shown a picture – either a line drawing, illustration or photograph which is rather ambiguous, and is asked to describe what is going on – or tell a story about what is illustrated.
4. Observation Method
Observation method is another very powerful tool for getting information about the consumer. This method is used for recording behaviour of people, objects, events. Informal observations are extensively used for observing customer buying patterns, impact of competitive advertisement on buying, product availability etc.
Observation technique is always used in conjunction with other research techniques. The inherent danger in this method is that one could draw wrong conclusions as it is highly subjective, and a lot depends upon the observer’s perception of a situation.