
It is a graphical representation of the cost-volume-profit relationship.
Example
A restaurant has a seating capacity of 180 covers, enabling to serve a total of 10,080 customers per twenty-eight-day trading period over lunch and dinner. The ASP of the customers is £15 (total maximum sales of £151,200). The fixed costs of the restaurant are £35,000 per period and the variable costs are 40% of sales (maximum £60,480). The break-even chart of the restaurant would be prepared as shown.
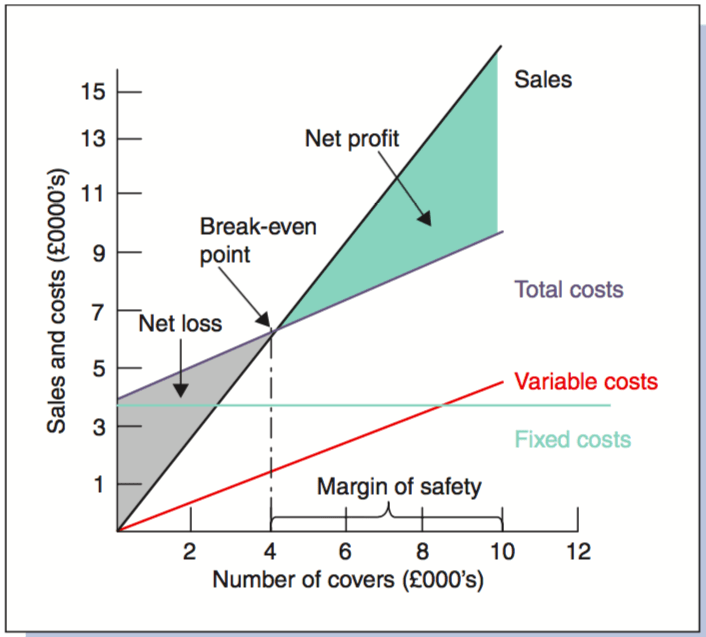
Drawing the diagram shows that 4,000 covers appear to be the break-even point, however, calculating the break-even point the accurate number would be 3,889. So the number of covers served between 3,889 and 10,080 will bring the restaurant some net profit. The output between the break-even point and the maximum output is known as the margin of safety.
The size of the margin of safety is a measure of the stability of the profits.
The higher the proportion of variable costs (to fixed costs), the greater the margin of safety, while the higher the proportion of fixed costs the narrower the margin of safety. Should the variable costs be increased (with the level of fixed costs remaining static) the break-even point will be raised resulting in a lower level of net profit and a smaller margin of safety.
Although a break-even chart shows diagrammatically the varying levels of profit or loss from different volumes of sales, the level of accuracy of the information may at times be in doubt owing to the scale of the graph and the skill of the person drawing it.
A precise break-even point may be calculated using the formula:
B/E = C/(S-V) = units of output at the break-even point
where,
C = the total capacity costs, that is, the costs of establishing the particular production capacity for an establishment (e.g. this would include rent, rates, insurance, salaries, building and machinery depreciation)
S = sales price per unit
V = variable cost per unit